30 of March of 2025
15 Looker Studio Tips to Create Smarter Dashboards

Isaac Correa
Looker Studio Templates
Data Integration & Sources
SEO & Marketing Dashboards

Build better dashboards in Looker Studio with 15 pro tips for filters, blending, styling, and calculated fields. No fluff, just what works.
15 Tips to Master Looker Studio (and Build Dashboards That Actually Work)
There’s a point in every project where data stops being an asset—and starts becoming a challenge.
You have information. You have Looker Studio. You even have clear goals.
But something’s still missing.
Most dashboards fall short not because of the tool, but because the setup doesn’t go deep enough.
This isn’t about dragging in a few charts. It’s about creating dashboards that offer real clarity.
Dashboards that guide decisions, spark alignment, and scale with you.
This guide breaks down 15 practical, professional-level tips to master Looker Studio—whether you're a marketer, analyst, or product lead. Every section includes clear instructions so you can implement the ideas immediately.
And yes, these are the same best practices we’ve already applied in our Looker Studio templates—used by teams that need to move fast and make smarter decisions.
Let’s begin with the fundamentals: structure, clarity, and control.
1. Use Calculated Fields to Translate Raw Data into Real Insights
 Most users rely only on the dimensions and metrics provided by their data source.
That’s enough to build a chart—but not enough to build a strategic dashboard.
Calculated fields are where real customization begins. These allow you to define your own metrics, classifications, or labels, using logic that reflects how your business operates.
Instead of exporting to Excel or adding formulas in Google Sheets, you define the logic directly inside Looker Studio.
What You Can Do with Calculated Fields
- Create custom conversion rates
- Group countries or campaigns into performance tiers
- Segment landing pages or product categories based on behavior
- Classify transactions based on thresholds
- Standardize metrics across sources
This is particularly useful in dashboards shared across departments—calculated fields help ensure everyone is speaking the same language.
How to Set It Up
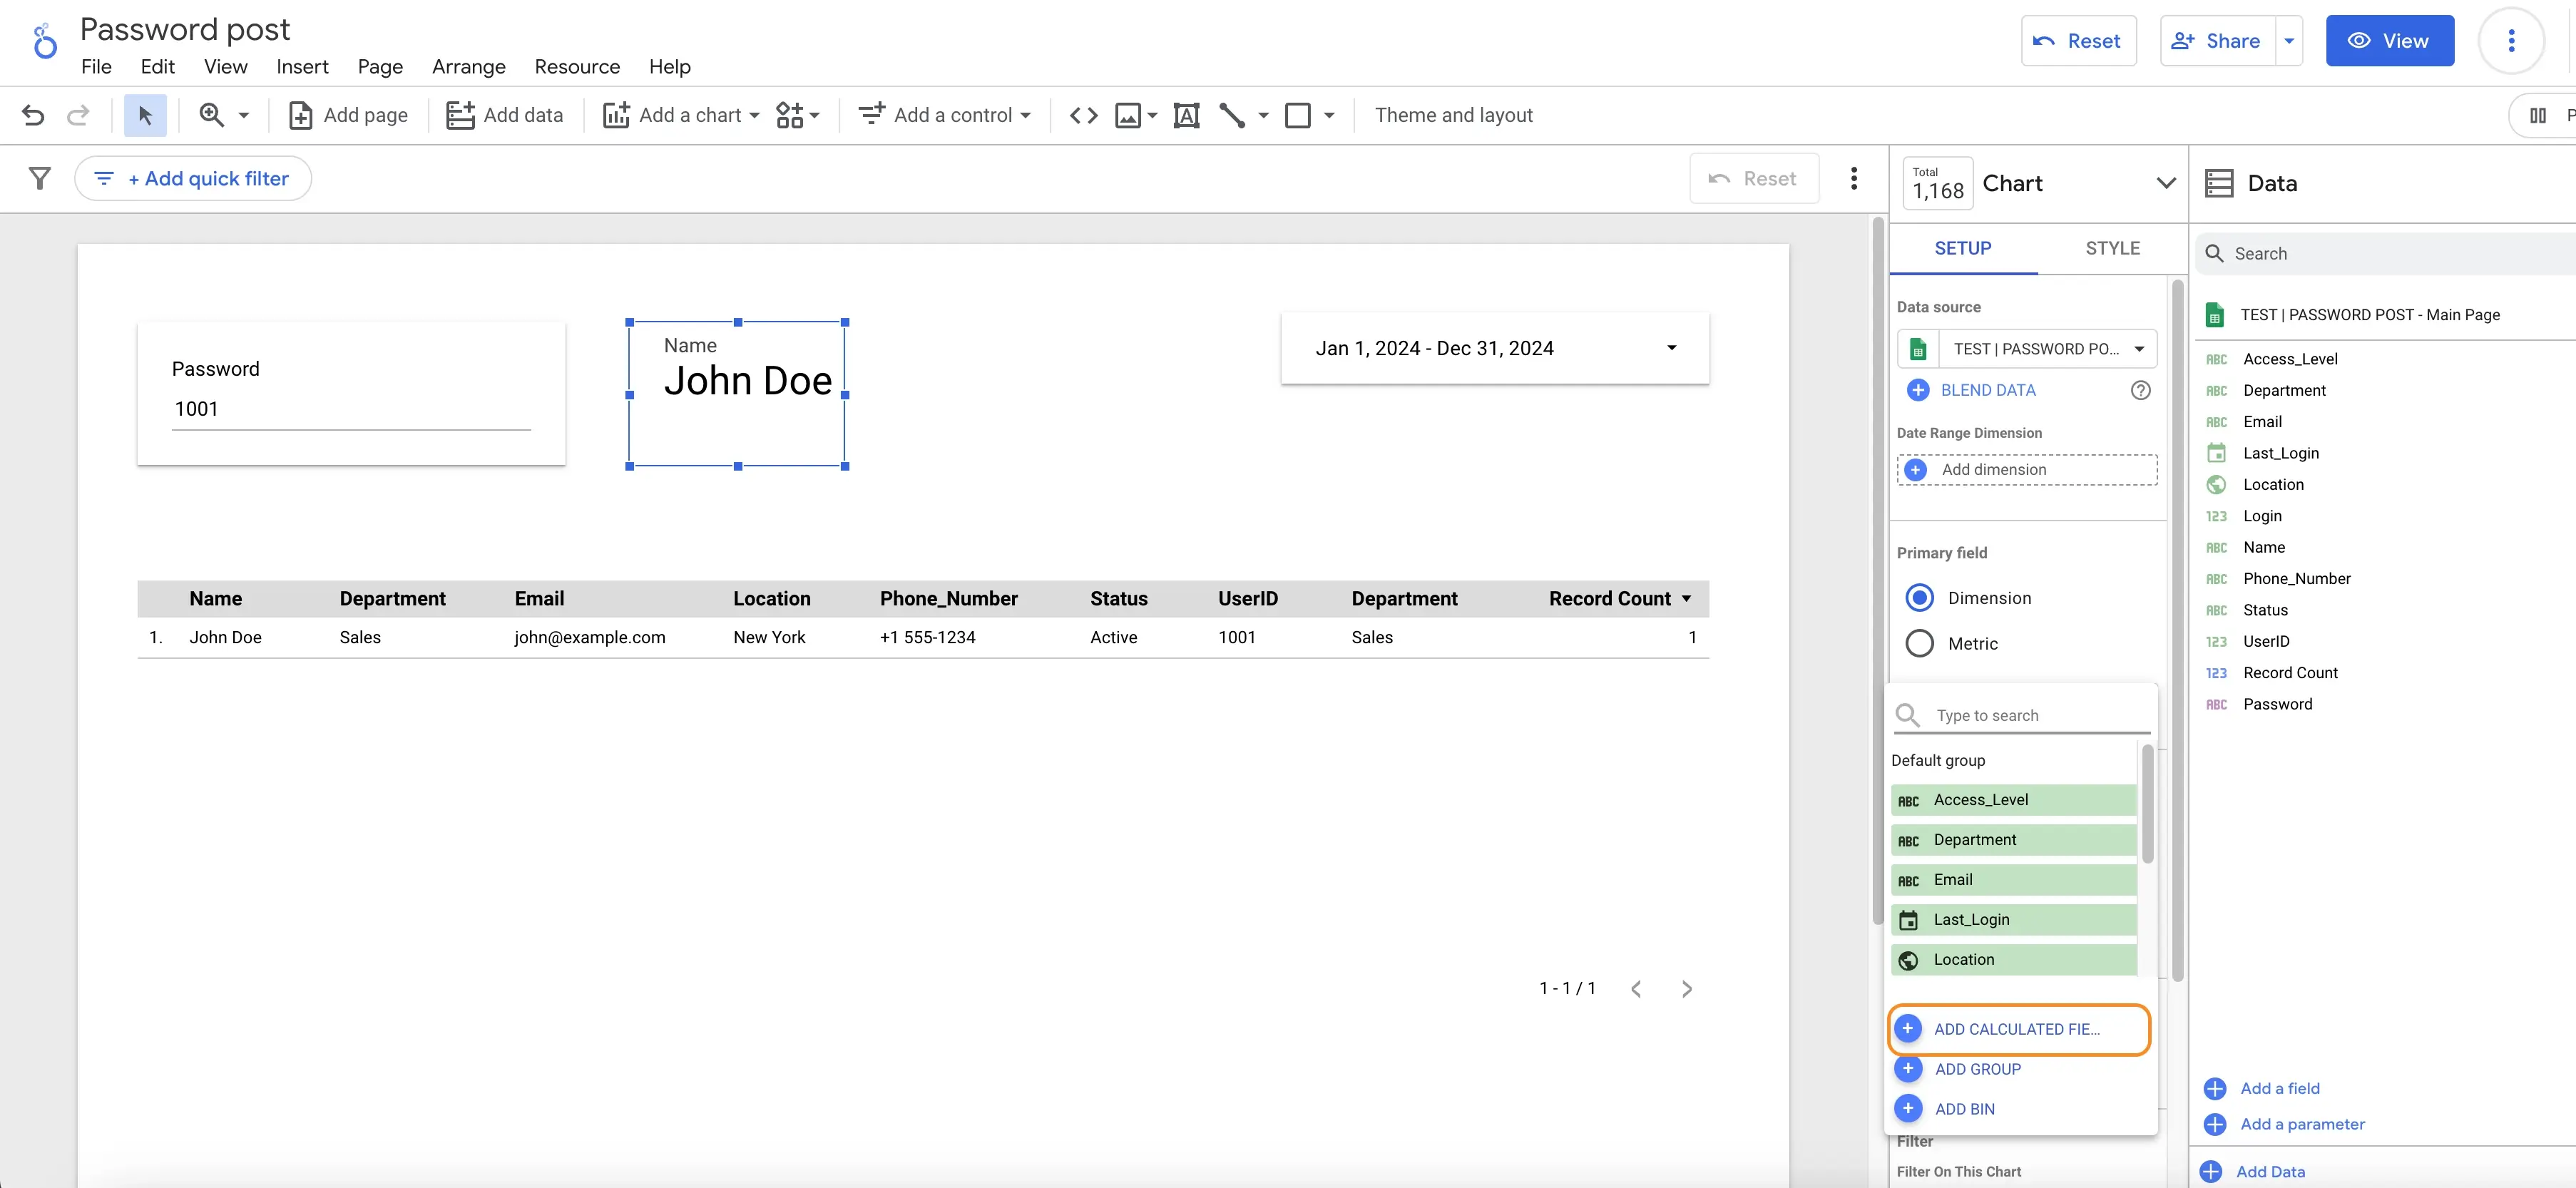
- In your report, click on a chart or table to bring up the Data panel on the right.
- Click “Add a field”.
- Enter a name and write the formula using Looker Studio’s expression language. Examples:
Conversion Rate = Conversions / ClicksCASE WHEN Cost > 500 THEN "High Spend" ELSE "Low Spend" ENDREGEXP_MATCH(Page, ".*checkout.*")to detect checkout URLs
- Click Save. The new field will appear as a selectable metric or dimension.
Best Practices
- Keep field names simple and human-readable
- Use
CASElogic to map ranges or categories - Validate formulas often—Looker Studio flags syntax errors immediately
- Group your calculated fields into reusable templates for future dashboards
This is one of the fastest ways to build dashboards that work across teams, not just for analysts.
Reference article: Dimensions vs Metrics in Looker Studio | Best Practices & Templates
2. Enable Period-over-Period Comparison to Gain Instant Perspective
 A metric is only meaningful when you understand how it changes.
One of the most underused but powerful features in Looker Studio is the ability to compare date ranges automatically.
This lets users track performance across time—month over month, quarter over quarter, or year over year—without switching tabs or referencing external spreadsheets.
Why This Matters
Comparing a number to its previous value adds instant context.
Instead of just seeing "32,400 sessions", you’ll see "32,400 sessions (+6.2%)".
This simple delta is often the difference between insight and confusion.
In decision-making environments, this builds trust and saves time. No need to ask "How did we do last month?"—it’s right there.
How to Implement It
- Click on any chart that supports time-series data or use a scorecard component.
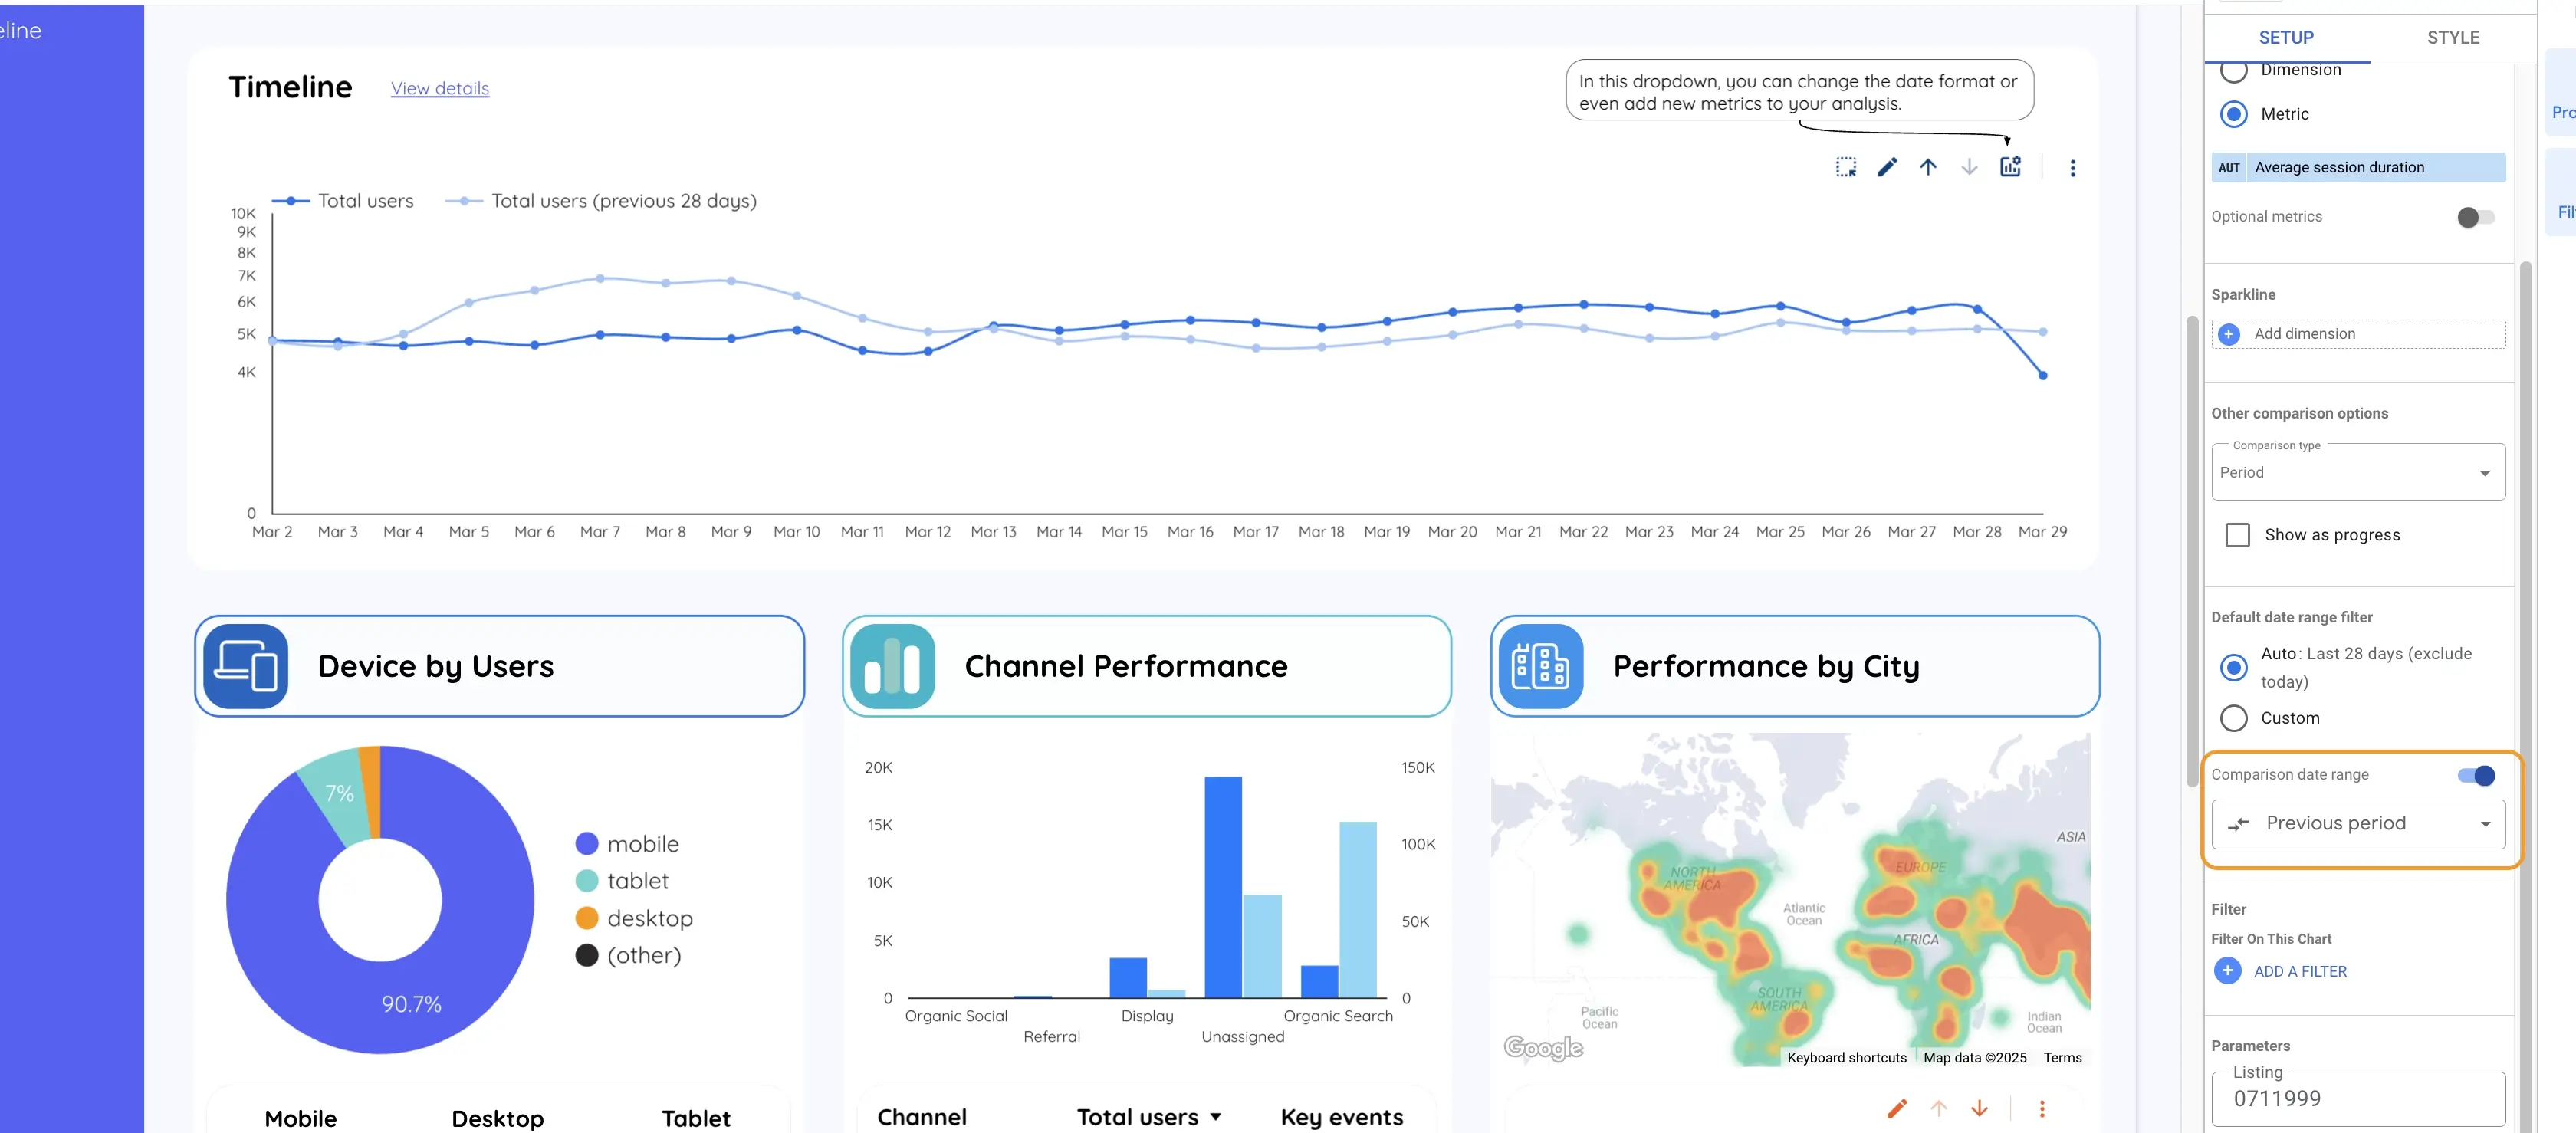
- In the Data panel, locate the date control options.
- Check the box for “Compare to previous period”.
- Choose whether to compare to:
- The previous period (e.g., previous 30 days)
- The same period last year
- The component will now show:
- The previous value
- The percentage change
- Visual indicators if desired (arrows, color changes)
When to Use This
- Scorecards for KPIs like revenue, sessions, or conversions
- Time-series charts for campaigns, traffic sources, or product performance
- Monthly or quarterly dashboards shared with leadership
This feature improves clarity instantly. It turns flat data into a story.
Reference article: Create Your First Dashboard: A Looker Studio Guide
3. Apply Consistent Styling to Make Your Dashboard Clear and Credible
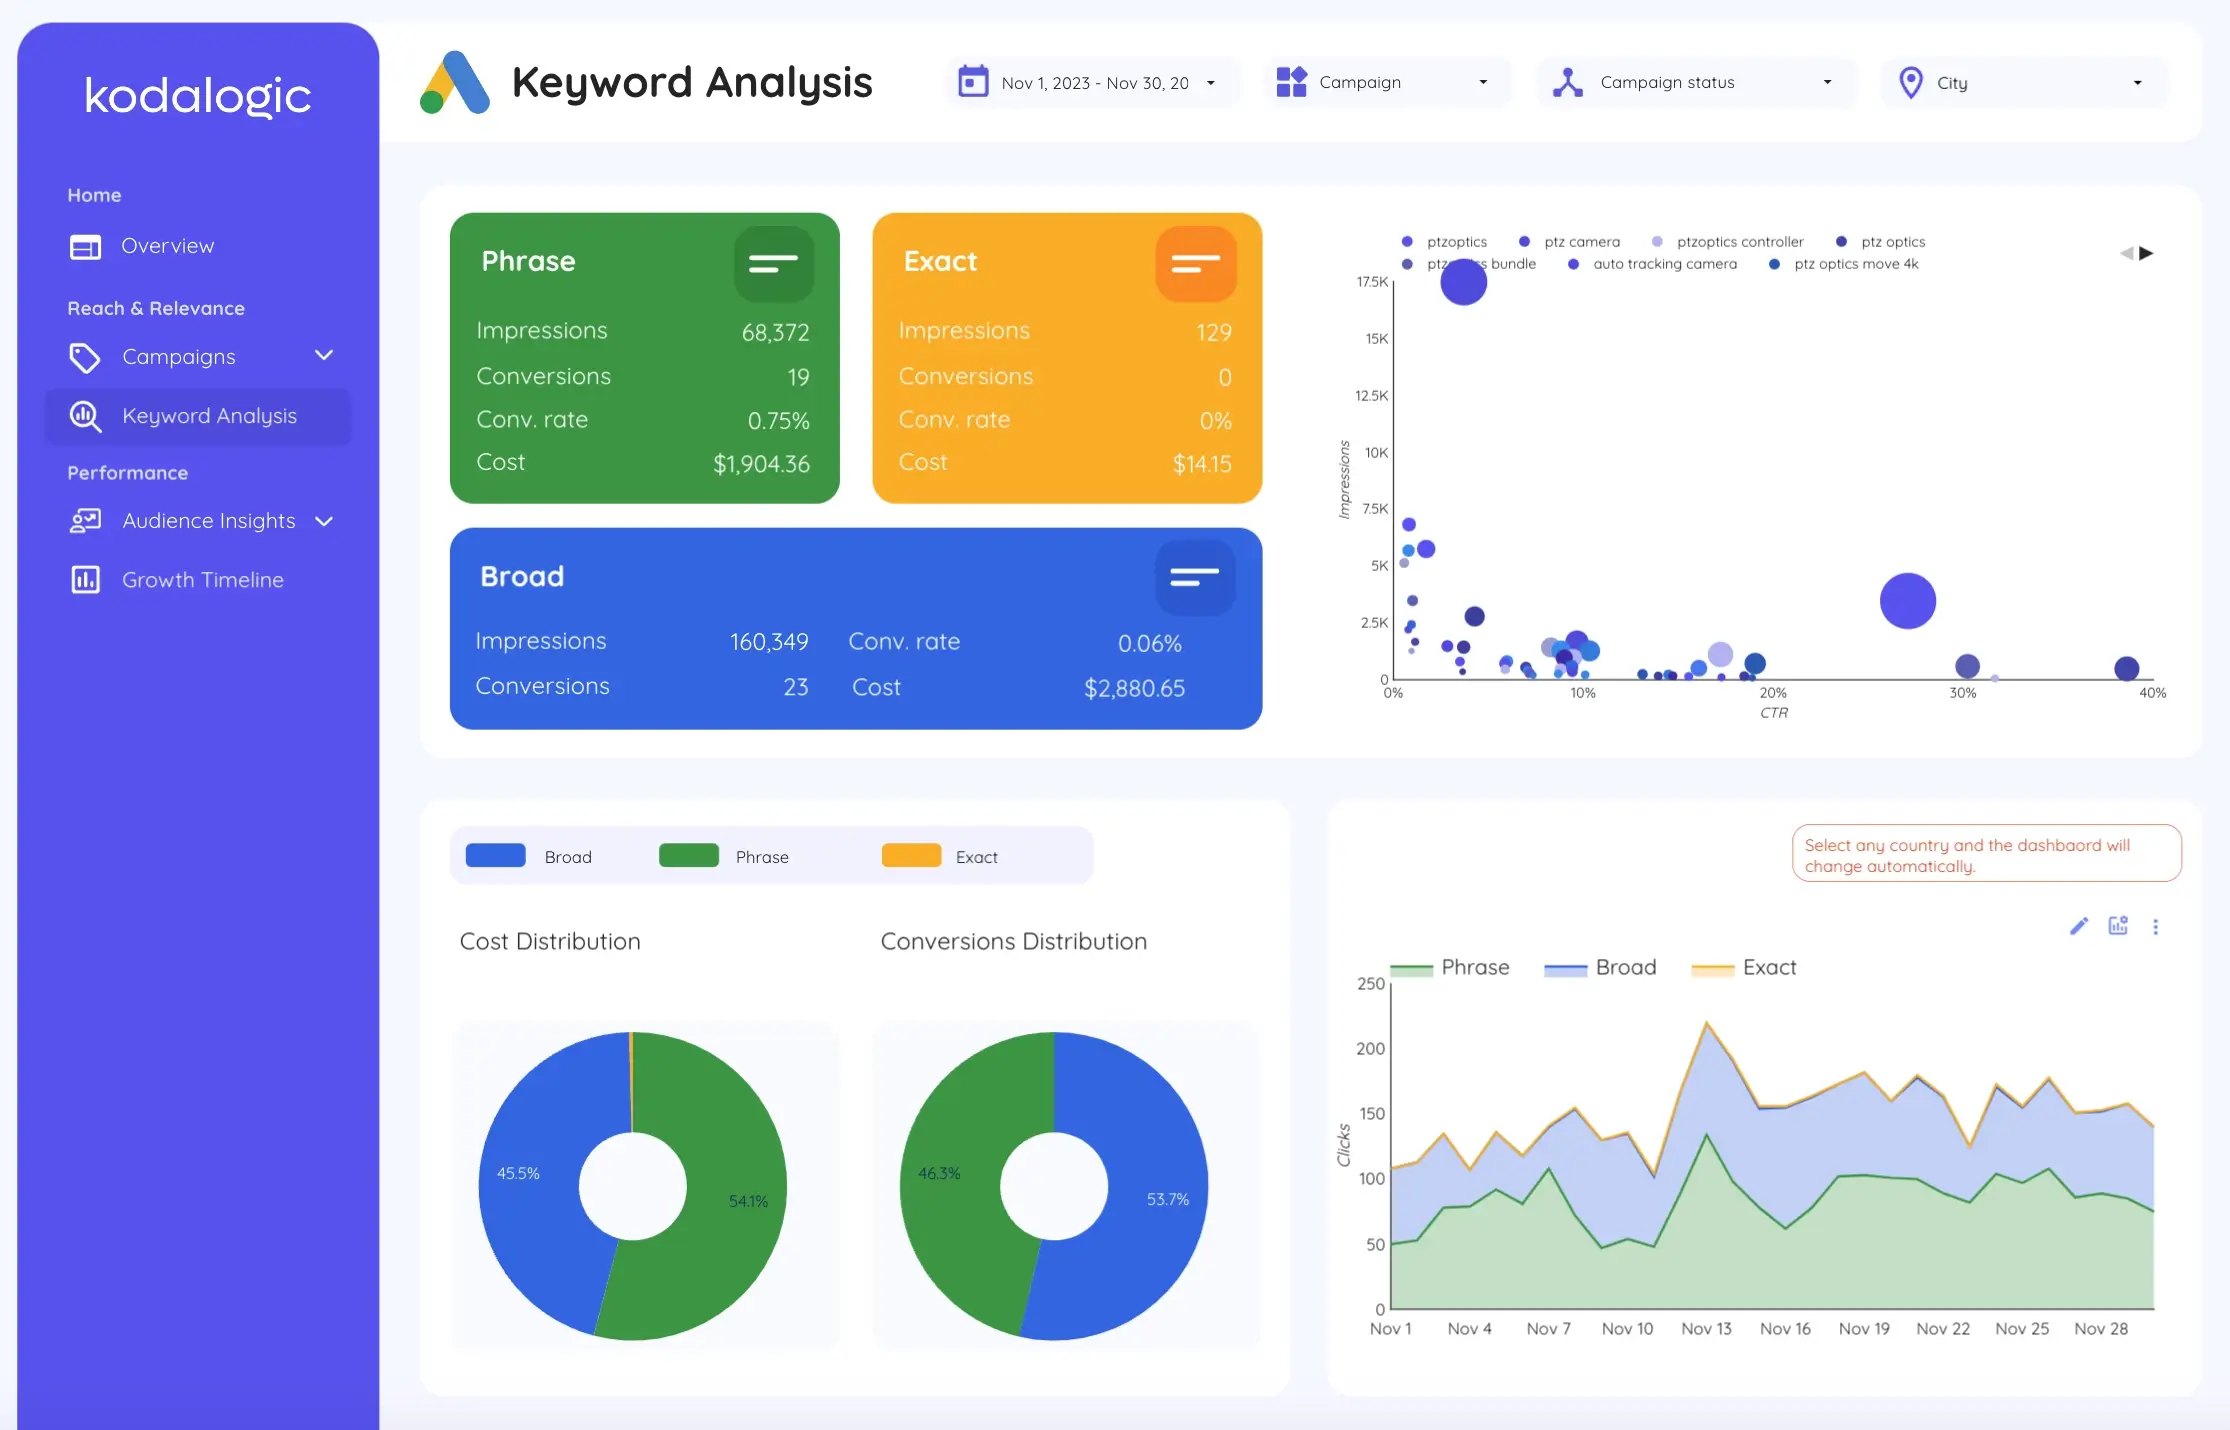
A great dashboard is more than charts and filters.
It’s a structured interface where information flows smoothly, hierarchy is respected, and visual distractions are removed.
Looker Studio provides extensive customization options that are often ignored—but styling is not a visual bonus. It’s a functional requirement.
Core Style Elements You Should Control
- Font family and size
- Colors and contrast
- Alignment and grid spacing
- Component borders and background shading
- Consistent use of white space
If you want your dashboard to be user-friendly, this is where you focus.
Step-by-Step: How to Customize Dashboard Style
- Click on the background of the page (not a specific component).
- Open the Style panel on the right.
- Choose or customize a theme:
- Use brand colors for charts and accents
- Select clean, readable fonts like Roboto or Open Sans
- Use neutral background tones (light grey or white) for readability
- For each component (tables, scorecards, charts):
- Apply consistent borders or shadows
- Use bold text for titles and labels
- Align elements using guides or snap-to-grid
- Limit to 2–3 highlight colors for emphasis
Best Practices
- Use light backgrounds and dark text for high contrast
- Reserve color only for actionable elements or alerts
- Group related elements visually
- Avoid overlapping text or uncontrolled resizing
This is how you create dashboards that people want to use—dashboards that feel clean, fast, and intentional.
Reference article: Agency Reporting Made Easy with Looker Dashboards
These first three tips form the foundation of every high-performing Looker Studio dashboard.
They turn a report into a decision tool, and a data source into a strategic asset.
In the next section, we’ll move into interaction, filters, and advanced data control—covering:
- Page-level filters
- User controls
- Data blending
- Parameter-driven customization
4. Apply Page-Level Filters to Simplify Control Without Repetition
One of the most overlooked features in Looker Studio is page-level filtering.
It allows you to set a single filter that automatically applies to all charts on a page—without having to configure each one individually.
This is especially useful when building dashboards with multiple sections (overview, acquisition, conversions, etc.), where each page needs to show different slices of the same dataset.
Why This Matters
- Reduces clutter by removing repeated filter controls
- Prevents inconsistent filtering across charts
- Allows users to navigate with confidence—knowing every chart on the page is aligned
- Ideal for executive summaries and marketing dashboards with clear segmentation
How to Set It Up
- Go to the page where you want to apply the filter.
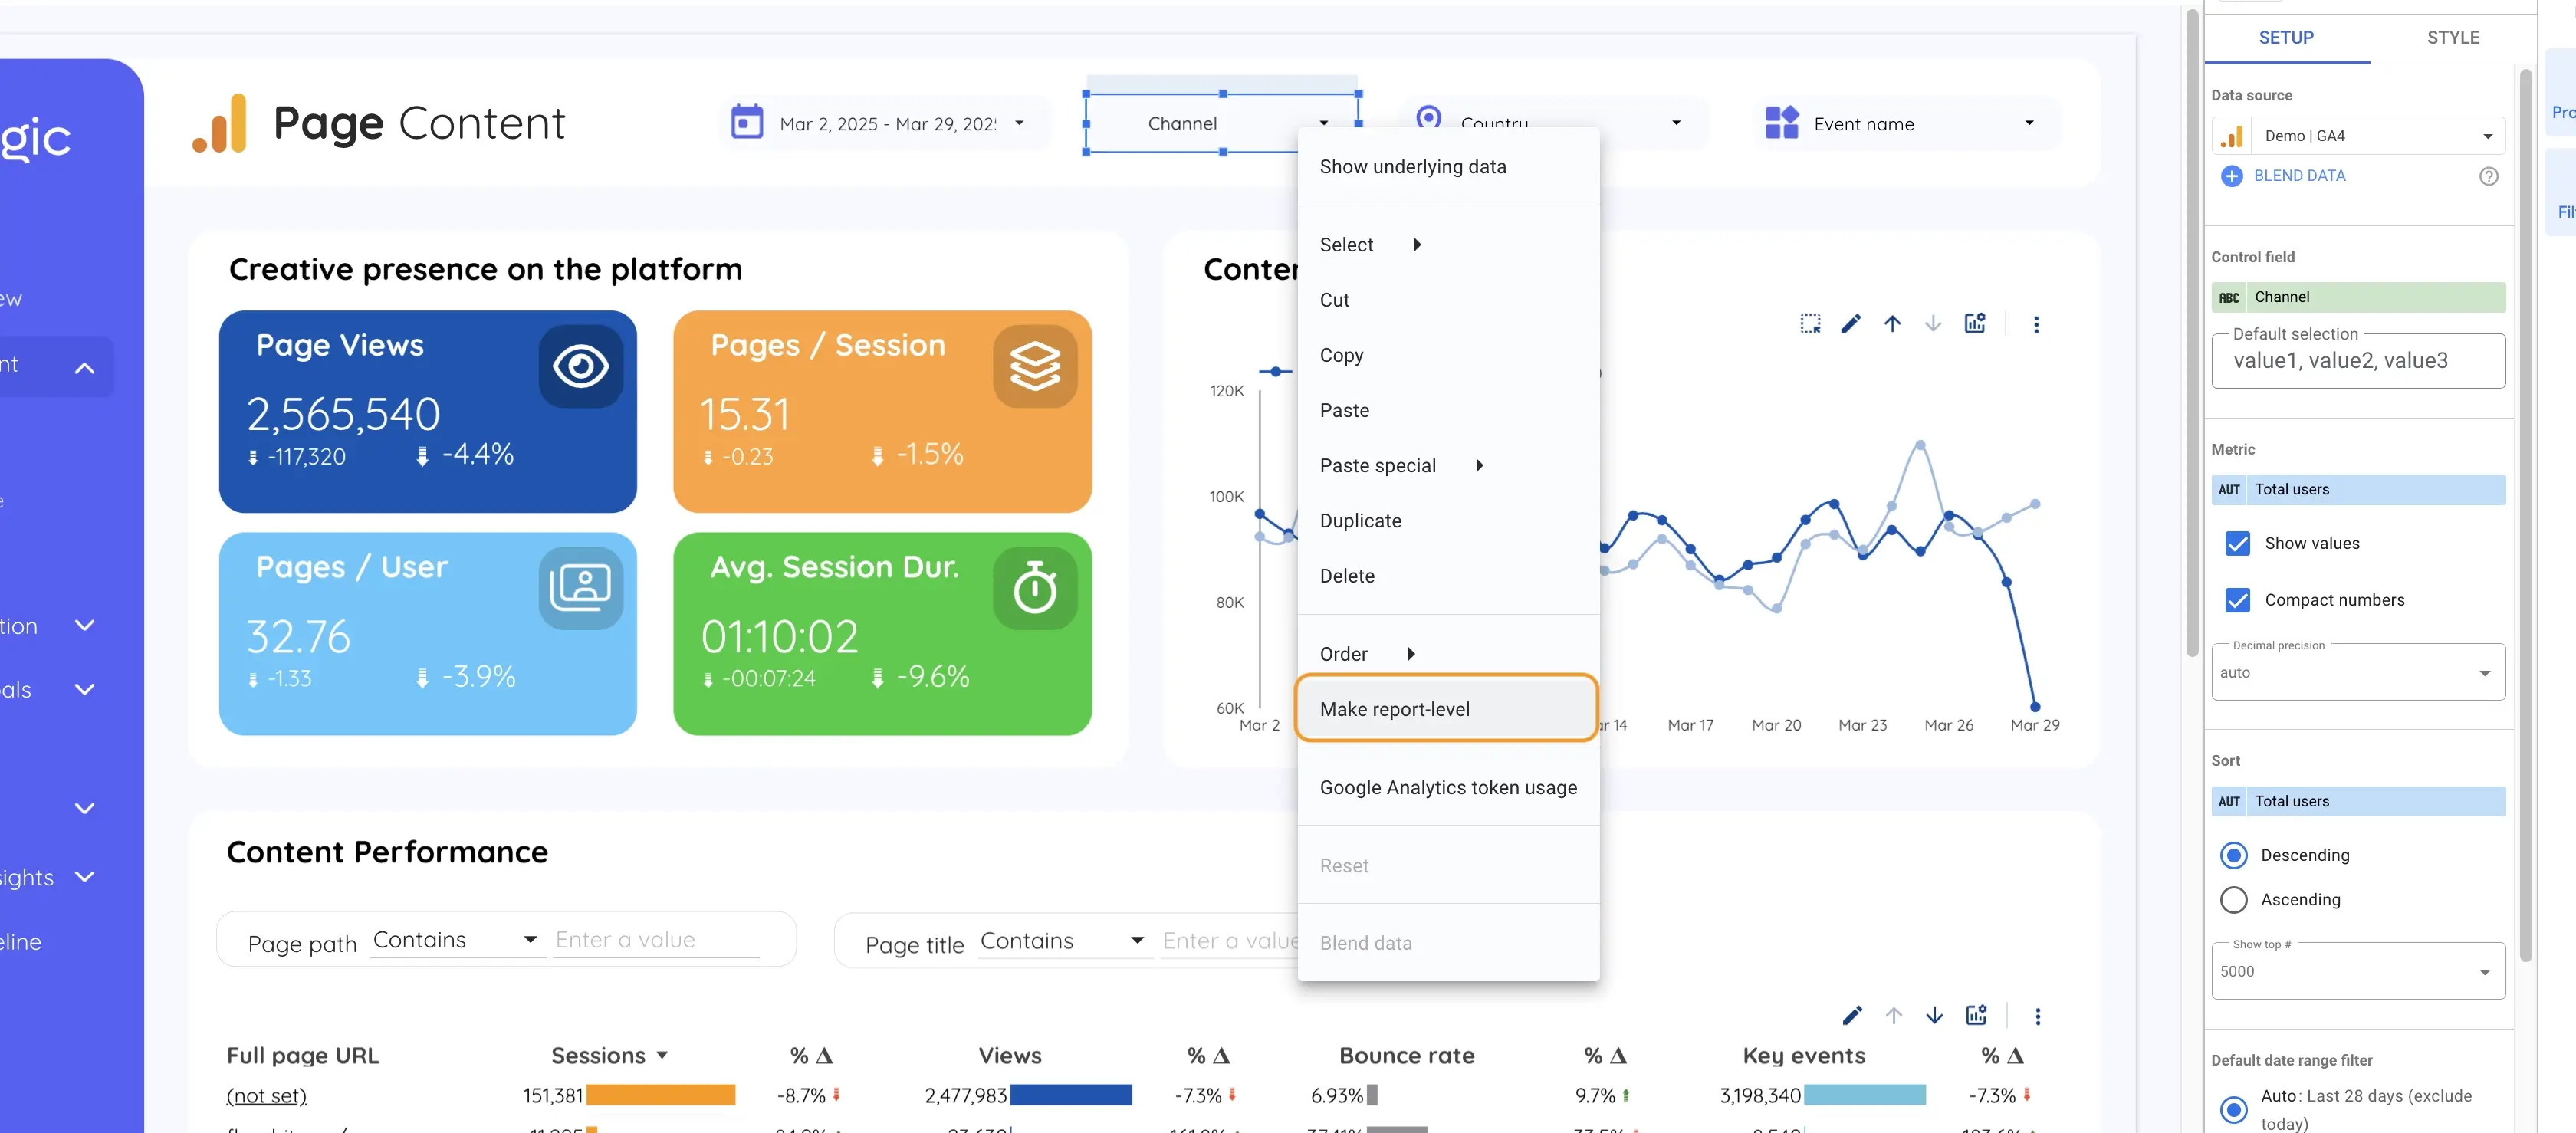
- From the top menu, click “Insert” > “Dropdown list” (or any filter control like checkbox, input box, etc.).
- Place the control anywhere on the canvas.
- Select the control and open the “Data” panel.
- Choose the dimension you want to filter by (e.g., Country, Campaign, Device, Channel).
- Under the control’s “Scope”, select “Apply filter to this page”.
- This ensures that all charts on the page respond to the same filter.
Best Practices
- Use page-level filters for high-level dimensions like geography, date, or device
- Label filters clearly so users know what they’re selecting
- Avoid combining too many filters—simplicity is clarity
- Place filters consistently across all pages to create visual familiarity
Page-level filters make your dashboards feel coherent and purposeful. They remove guesswork and give users exactly the control they need—nothing more, nothing less.
Reference article: Customizing Looker Studio Dashboards: Colors and Logos Made Easy
5. Use Interactive Controls to Let Users Explore the Data on Their Own
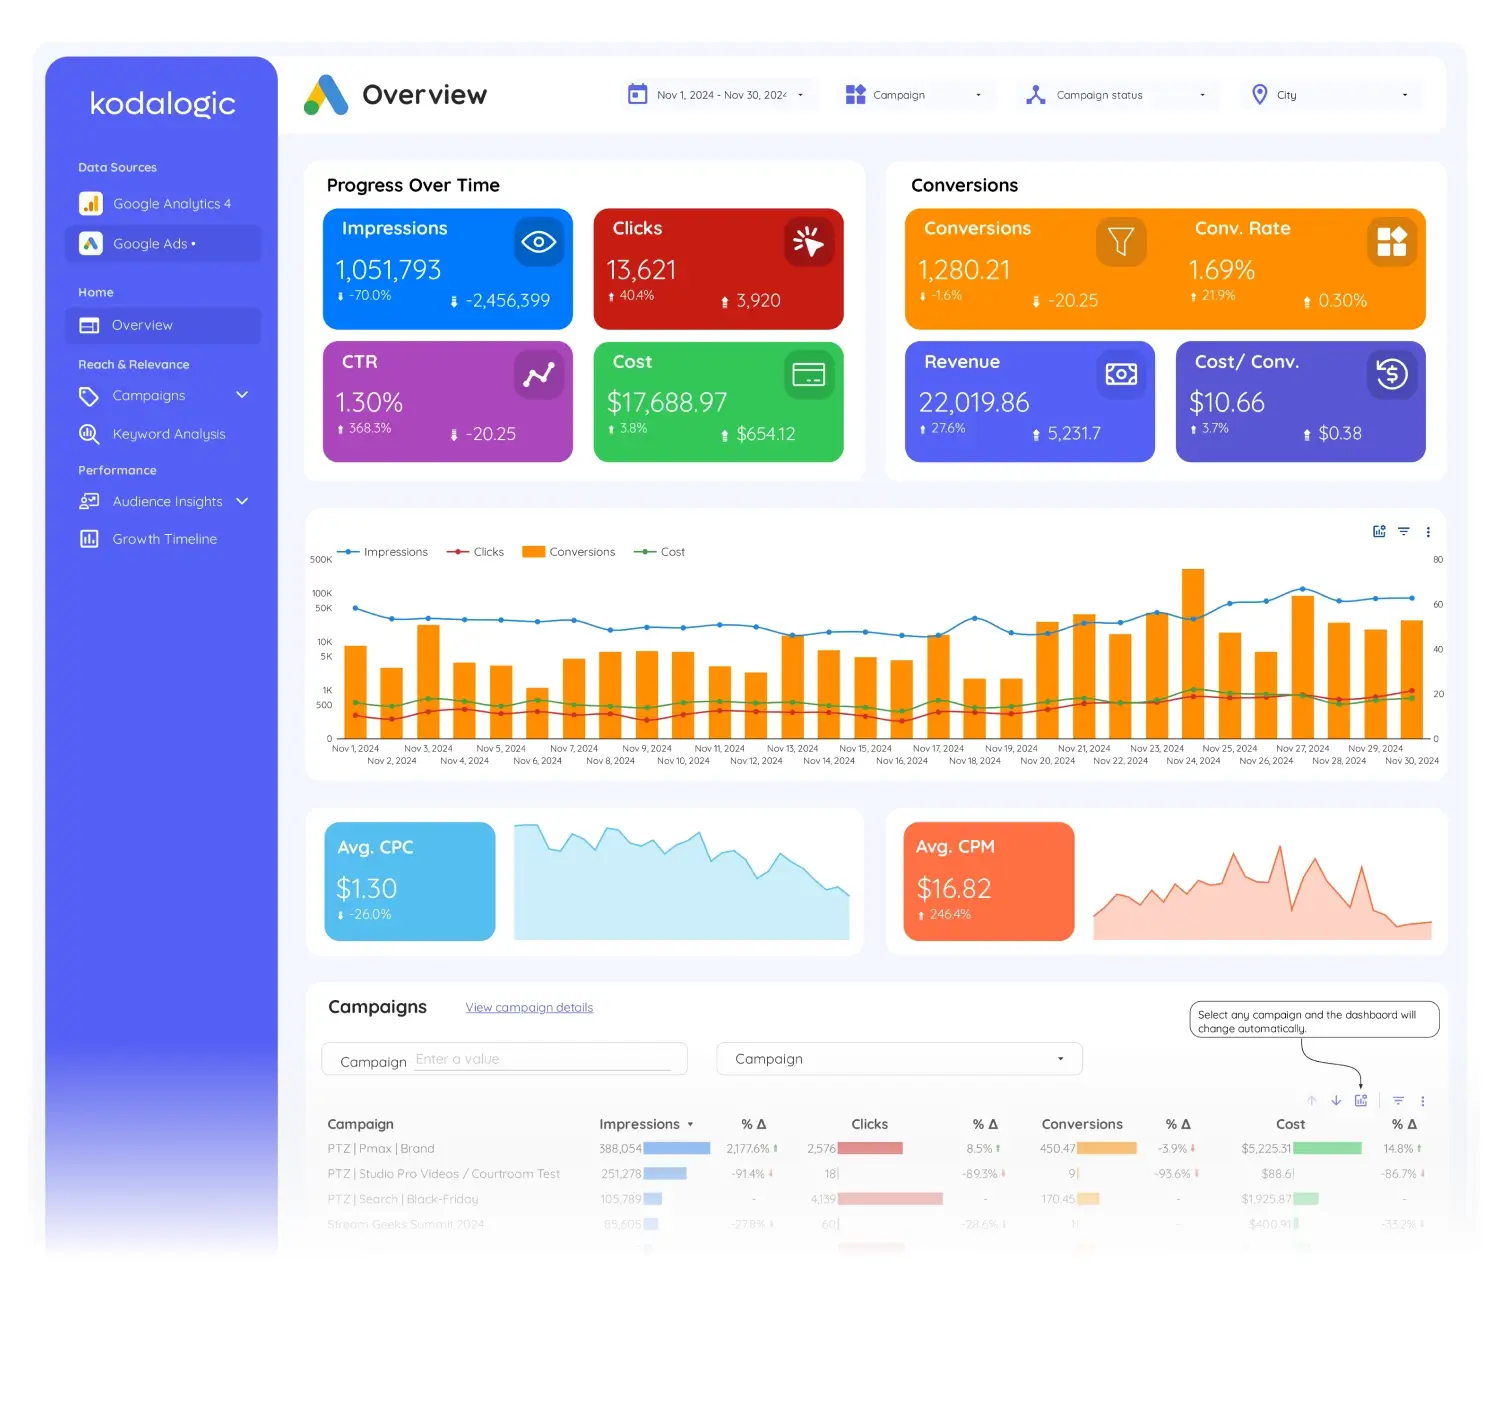
Static dashboards are a thing of the past.
Looker Studio allows you to build interactive dashboards—ones that adapt in real time to what the user wants to explore.
With dropdowns, sliders, input fields, and search boxes, you can build dashboards that behave more like applications: flexible, dynamic, and self-explanatory.
Types of Interactive Controls
- Dropdown Lists: For selecting values from a list (e.g., campaign names)
- Sliders: For setting ranges (e.g., budget greater than $1000)
- Search Boxes: For keyword filtering (e.g., product names)
- Date Range Pickers: To adjust the timeframe for the entire report
- Input Boxes: To let users define thresholds or values (used with parameters)
How to Set It Up
-
Click “Insert” > “Dropdown list” (or other control) from the top menu.
-
Place the control where it makes sense in your layout.
-
In the Data panel, select the field the control should filter (e.g., Channel Grouping).
-
Decide whether to apply it to:
- The current chart only
- The entire page
- The entire report
-
Style the control using the Style panel for visual consistency.
When to Use Controls
- Letting stakeholders focus on their market, region, or product line
- Creating dashboards for multiple departments (Marketing, Sales, Support)
- Replacing multiple charts with one chart that adapts based on selection
Best Practices
- Keep controls visible but unobtrusive
- Use default values that display meaningful data when the report loads
- Limit the number of controls on a page to avoid decision fatigue
- Test on both desktop and mobile if the report is shared externally
Interactive dashboards are not just more engaging—they’re more powerful.
They transform users from passive viewers into active decision-makers.
Reference article: Why Looker Studio is the Go-To Data Tool for 2025
6. Blend Data from Multiple Sources Without Leaving Looker Studio
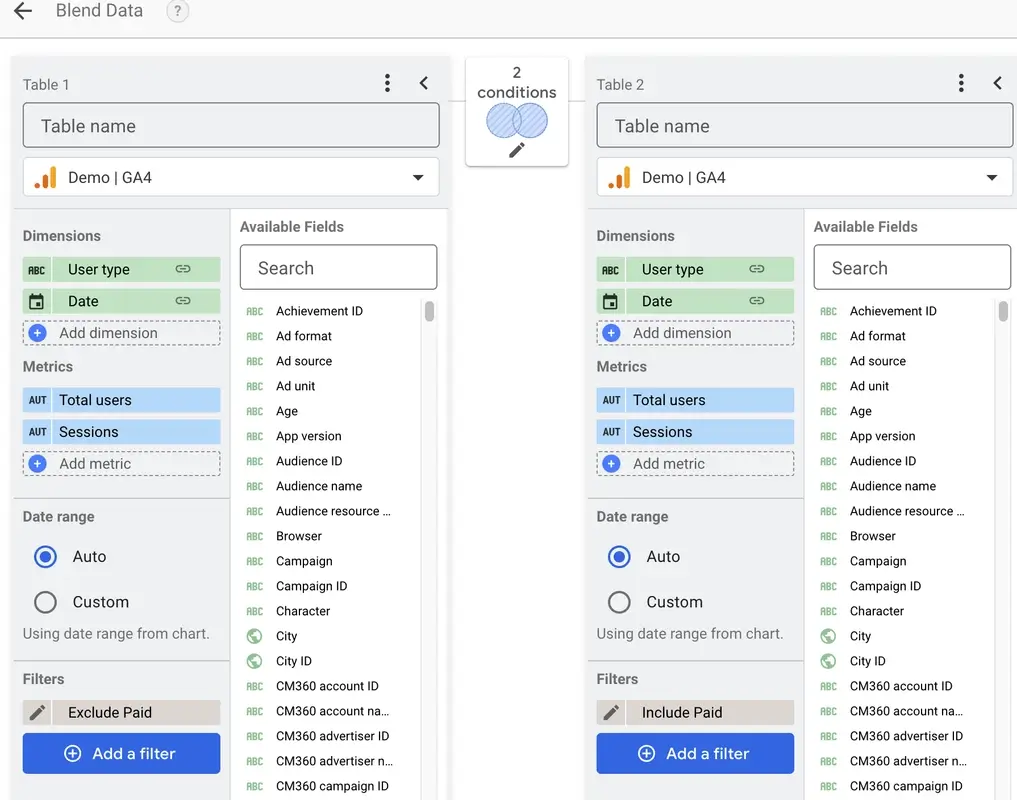
One of Looker Studio’s strongest features is the ability to create blended data sources—combining metrics and dimensions from different platforms into one unified view.
This is especially useful when you want to:
- Compare ad spend from Meta Ads and Google Ads
- Join CRM data with website conversions
- Overlay cost data with analytics data for ROAS analysis
- Create full-funnel dashboards (impressions > leads > revenue)
How Data Blending Works
Data blending works by identifying a common key between two or more datasets.
Once that key is established, you can pull in fields from each source into a single chart.
How to Set It Up
-
Create your charts as usual using one data source.
-
Select the chart, and in the Data panel, click “Blend data”.
-
Add a second data source.
-
In the join configuration screen:
- Choose the field that matches in both sources (e.g., Campaign Name, Date)
- Select the join type (most commonly Left Join)
- Pick the fields from each data source you want to include
-
Save the blend. You now have a custom data view with fields from both sources.
When to Use Data Blending
- Combining ad platform data with website analytics
- Matching CRM conversion data to campaign data
- Enriching GA4 data with custom backend metrics
Best Practices
- Use clean, standardized field names in all sources
- Avoid blending more than three sources at once for performance reasons
- Test your blended charts for accuracy—small mismatches can cause blank rows
- Use calculated fields within blends for advanced KPIs
Blending data in Looker Studio allows you to stop switching tabs, exporting files, or stitching insights manually. It’s how you build dashboards that reflect reality—not just fragments of it.
Reference article: What Is Looker Studio? The Essential Guide for 2025
7. Use Parameters to Let Users Define Inputs Dynamically
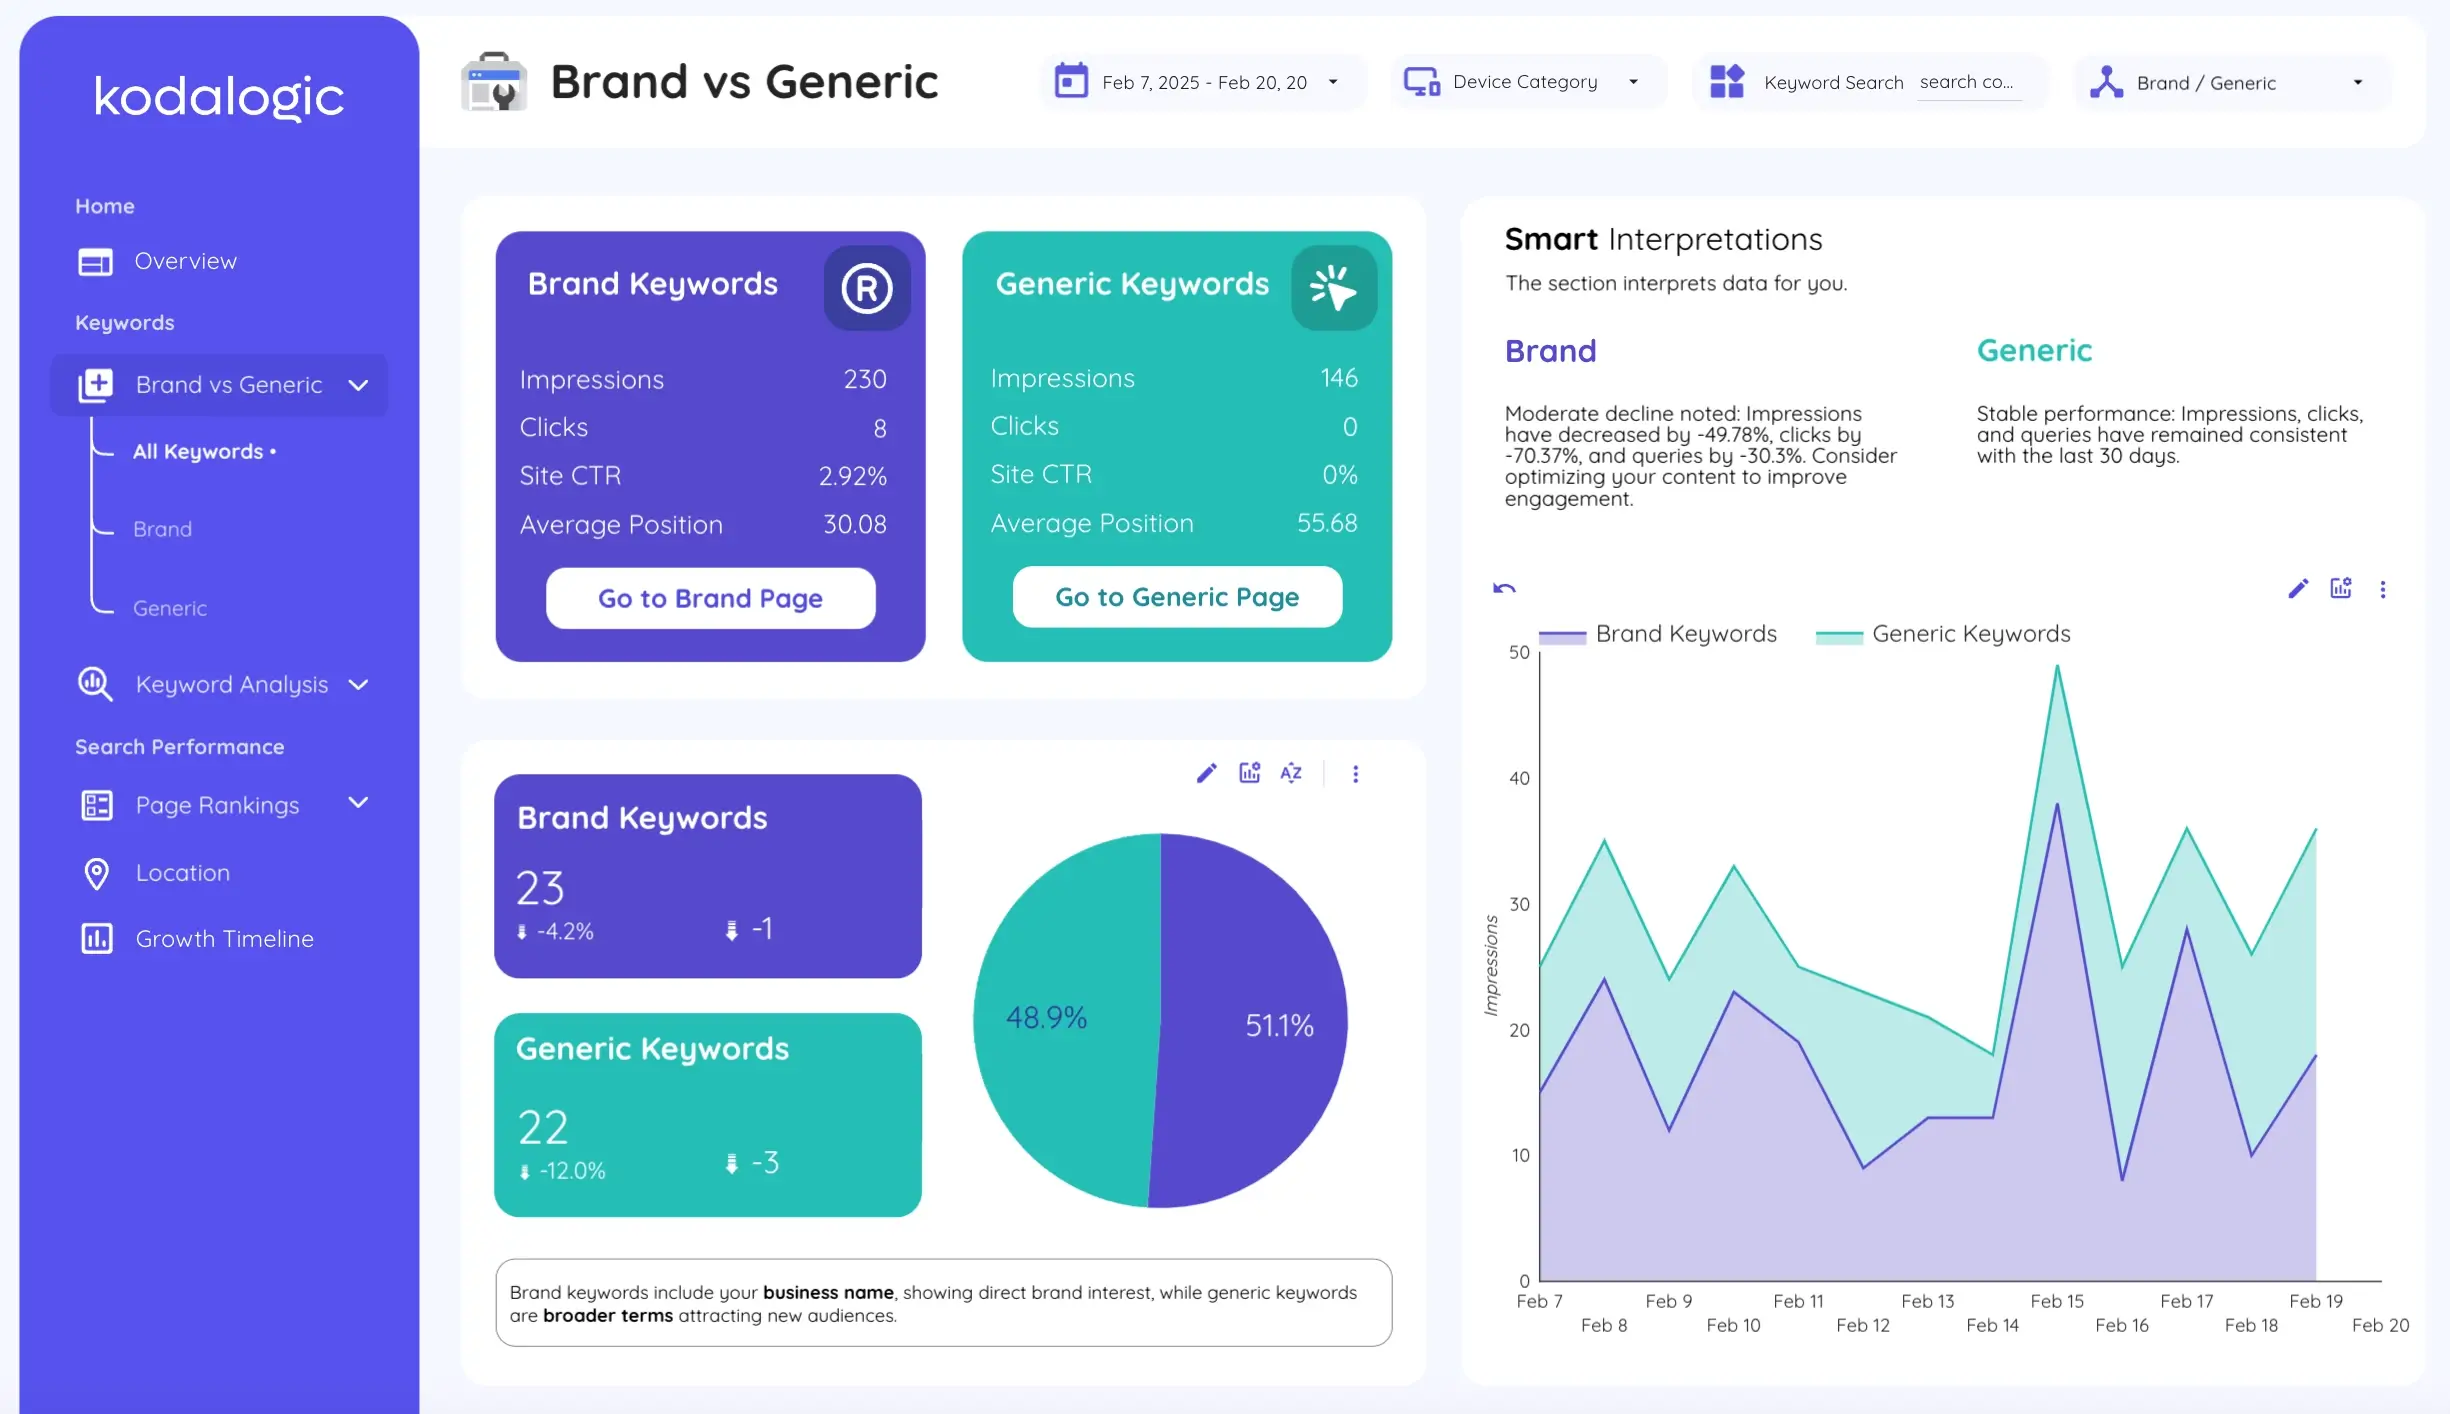
While most controls in Looker Studio are filters, parameters take interactivity to the next level.
They let users input values that affect how calculations are made—not just what is displayed.
This allows for dynamic simulations, threshold comparisons, and real-time scenario testing inside the dashboard.
What Parameters Can Do
- Let users define a budget and see ROAS calculated live
- Allow custom goal values for lead targets
- Compare real-time performance to dynamic baselines
- Change discount percentages and calculate impact instantly
Parameters make your dashboards more than just interactive—they make them predictive.
How to Set It Up
-
From the left panel, click “Add a Parameter”.
-
Define:
- Name (e.g., Target ROAS)
- Data Type (Text, Number, Boolean)
- Default Value
- Allowed Values (e.g., 1.2, 1.5, 2.0)
-
Create a calculated field that references the parameter:
- Example:
ROAS Gap = (Revenue / Cost) - Target ROAS
- Example:
-
Add a control (input box or dropdown) to let users change the parameter value.
-
Use the parameter in charts, tables, or scorecards.
Use Cases for Parameters
- Sales targets
- Budget thresholds
- ROI comparisons
- Pricing simulations
- Dynamic alerts based on KPI values
Best Practices
- Label parameter controls clearly so users know what they’re adjusting
- Combine parameters with filters to offer full customization
- Test with real business questions—parameters work best when used for specific decision points
- Avoid overcomplicating—start with one parameter and scale from there
Once you use parameters, your dashboards stop being static reports.
They become strategic tools that adapt to the way your team thinks.
Reference article: # Keyword Ranking Report Template: Track Your SEO Performance
8. Use Extracted Data Sources to Improve Speed and Stability
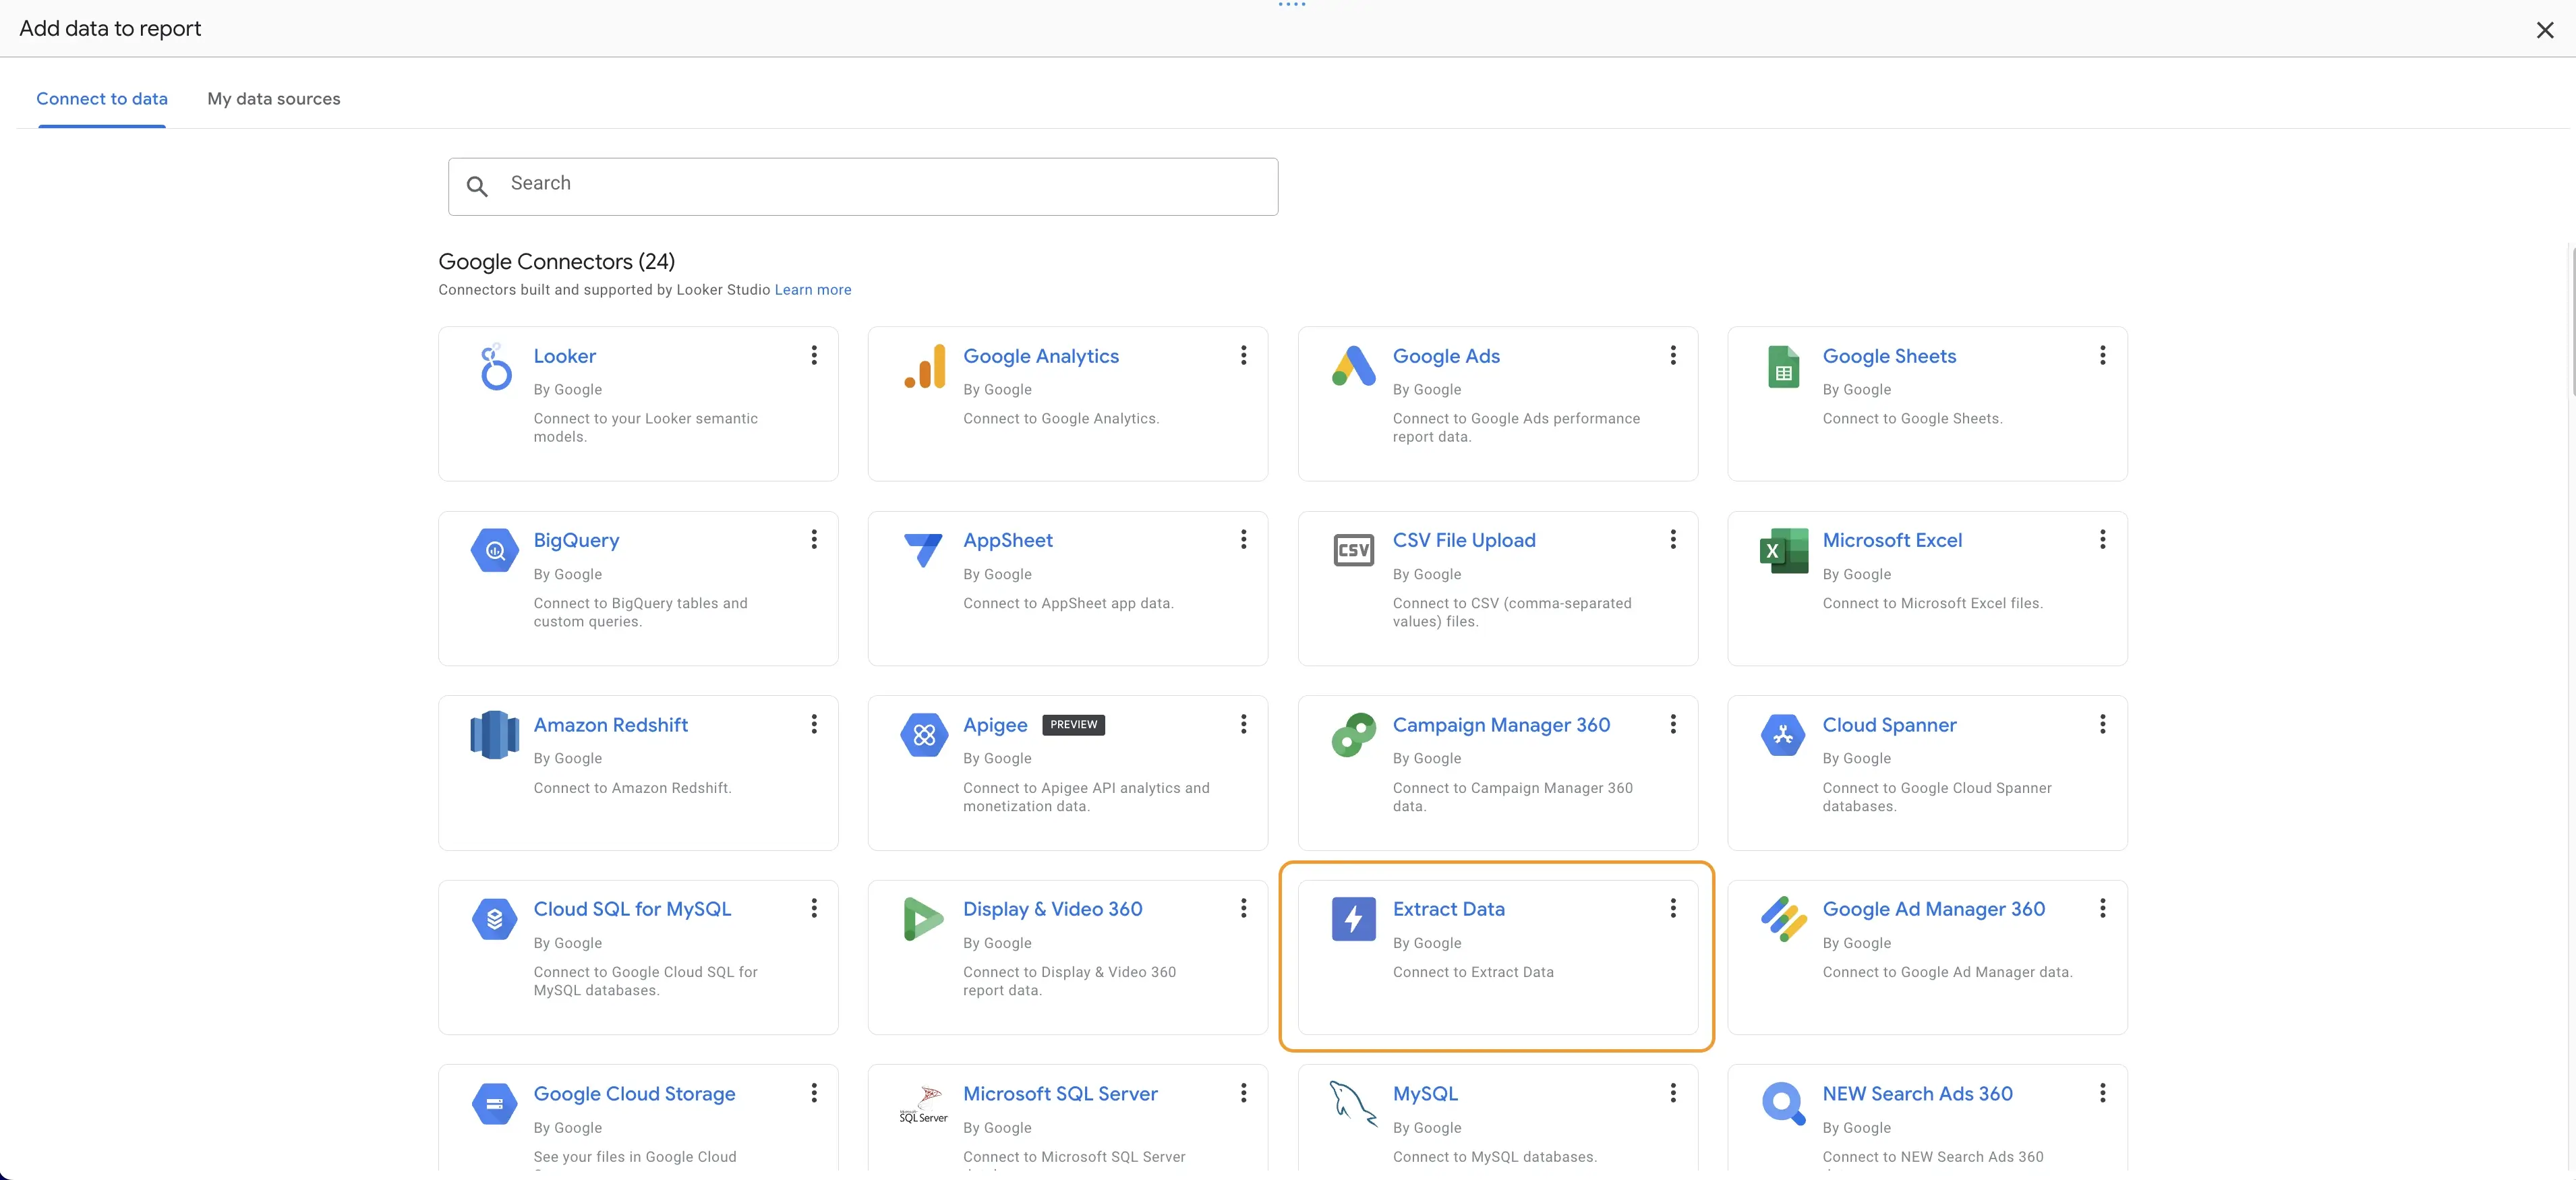
Large datasets and slow connections can quickly turn a useful dashboard into a frustrating experience.
That’s where Extracted Data Sources (also known as data extracts) come in.
They allow you to store a cached version of your data inside Looker Studio, improving load times dramatically—especially for reports with high traffic or shared externally.
What Extracts Do
Instead of querying the live data source every time the report is opened, Looker Studio pulls data from a stored snapshot.
This snapshot can be refreshed manually or on a schedule, depending on your needs.
When to Use Extracts
- Dashboards using Google Sheets, BigQuery, or APIs with limited quota
- Public dashboards or embedded reports
- Reports shared with executives who expect instant access
- Dashboards viewed frequently across time zones or teams
How to Set It Up
- Go to the Resources tab at the top of your report.
- Click Manage added data sources.
- Choose the source you want to convert and click Edit.
- At the top, select Extract Data.
- Choose:
- The fields you want to include
- A fixed or relative date range (e.g., last 30 days)
- How often the data should refresh (daily, weekly, etc.)
- Save and replace the original source in your charts with the new extract.
Best Practices
- Limit extracts to essential fields to reduce size and improve speed
- Set clear refresh intervals based on business needs (e.g., every morning at 6 AM)
- Name extracted sources clearly (e.g., "GA4 – Last 30 Days – Extract")
- Monitor performance regularly—especially after adding new filters or dimensions
Extracted data allows you to deliver fast, reliable dashboards even with complex data structures.
It’s not just a performance trick—it’s a better experience for every user who opens the report.
Reference article: Mastering Data Sources in Looker Studio: A Comprehensive Guide
9. Add Trendlines to Tell the Full Story at a Glance
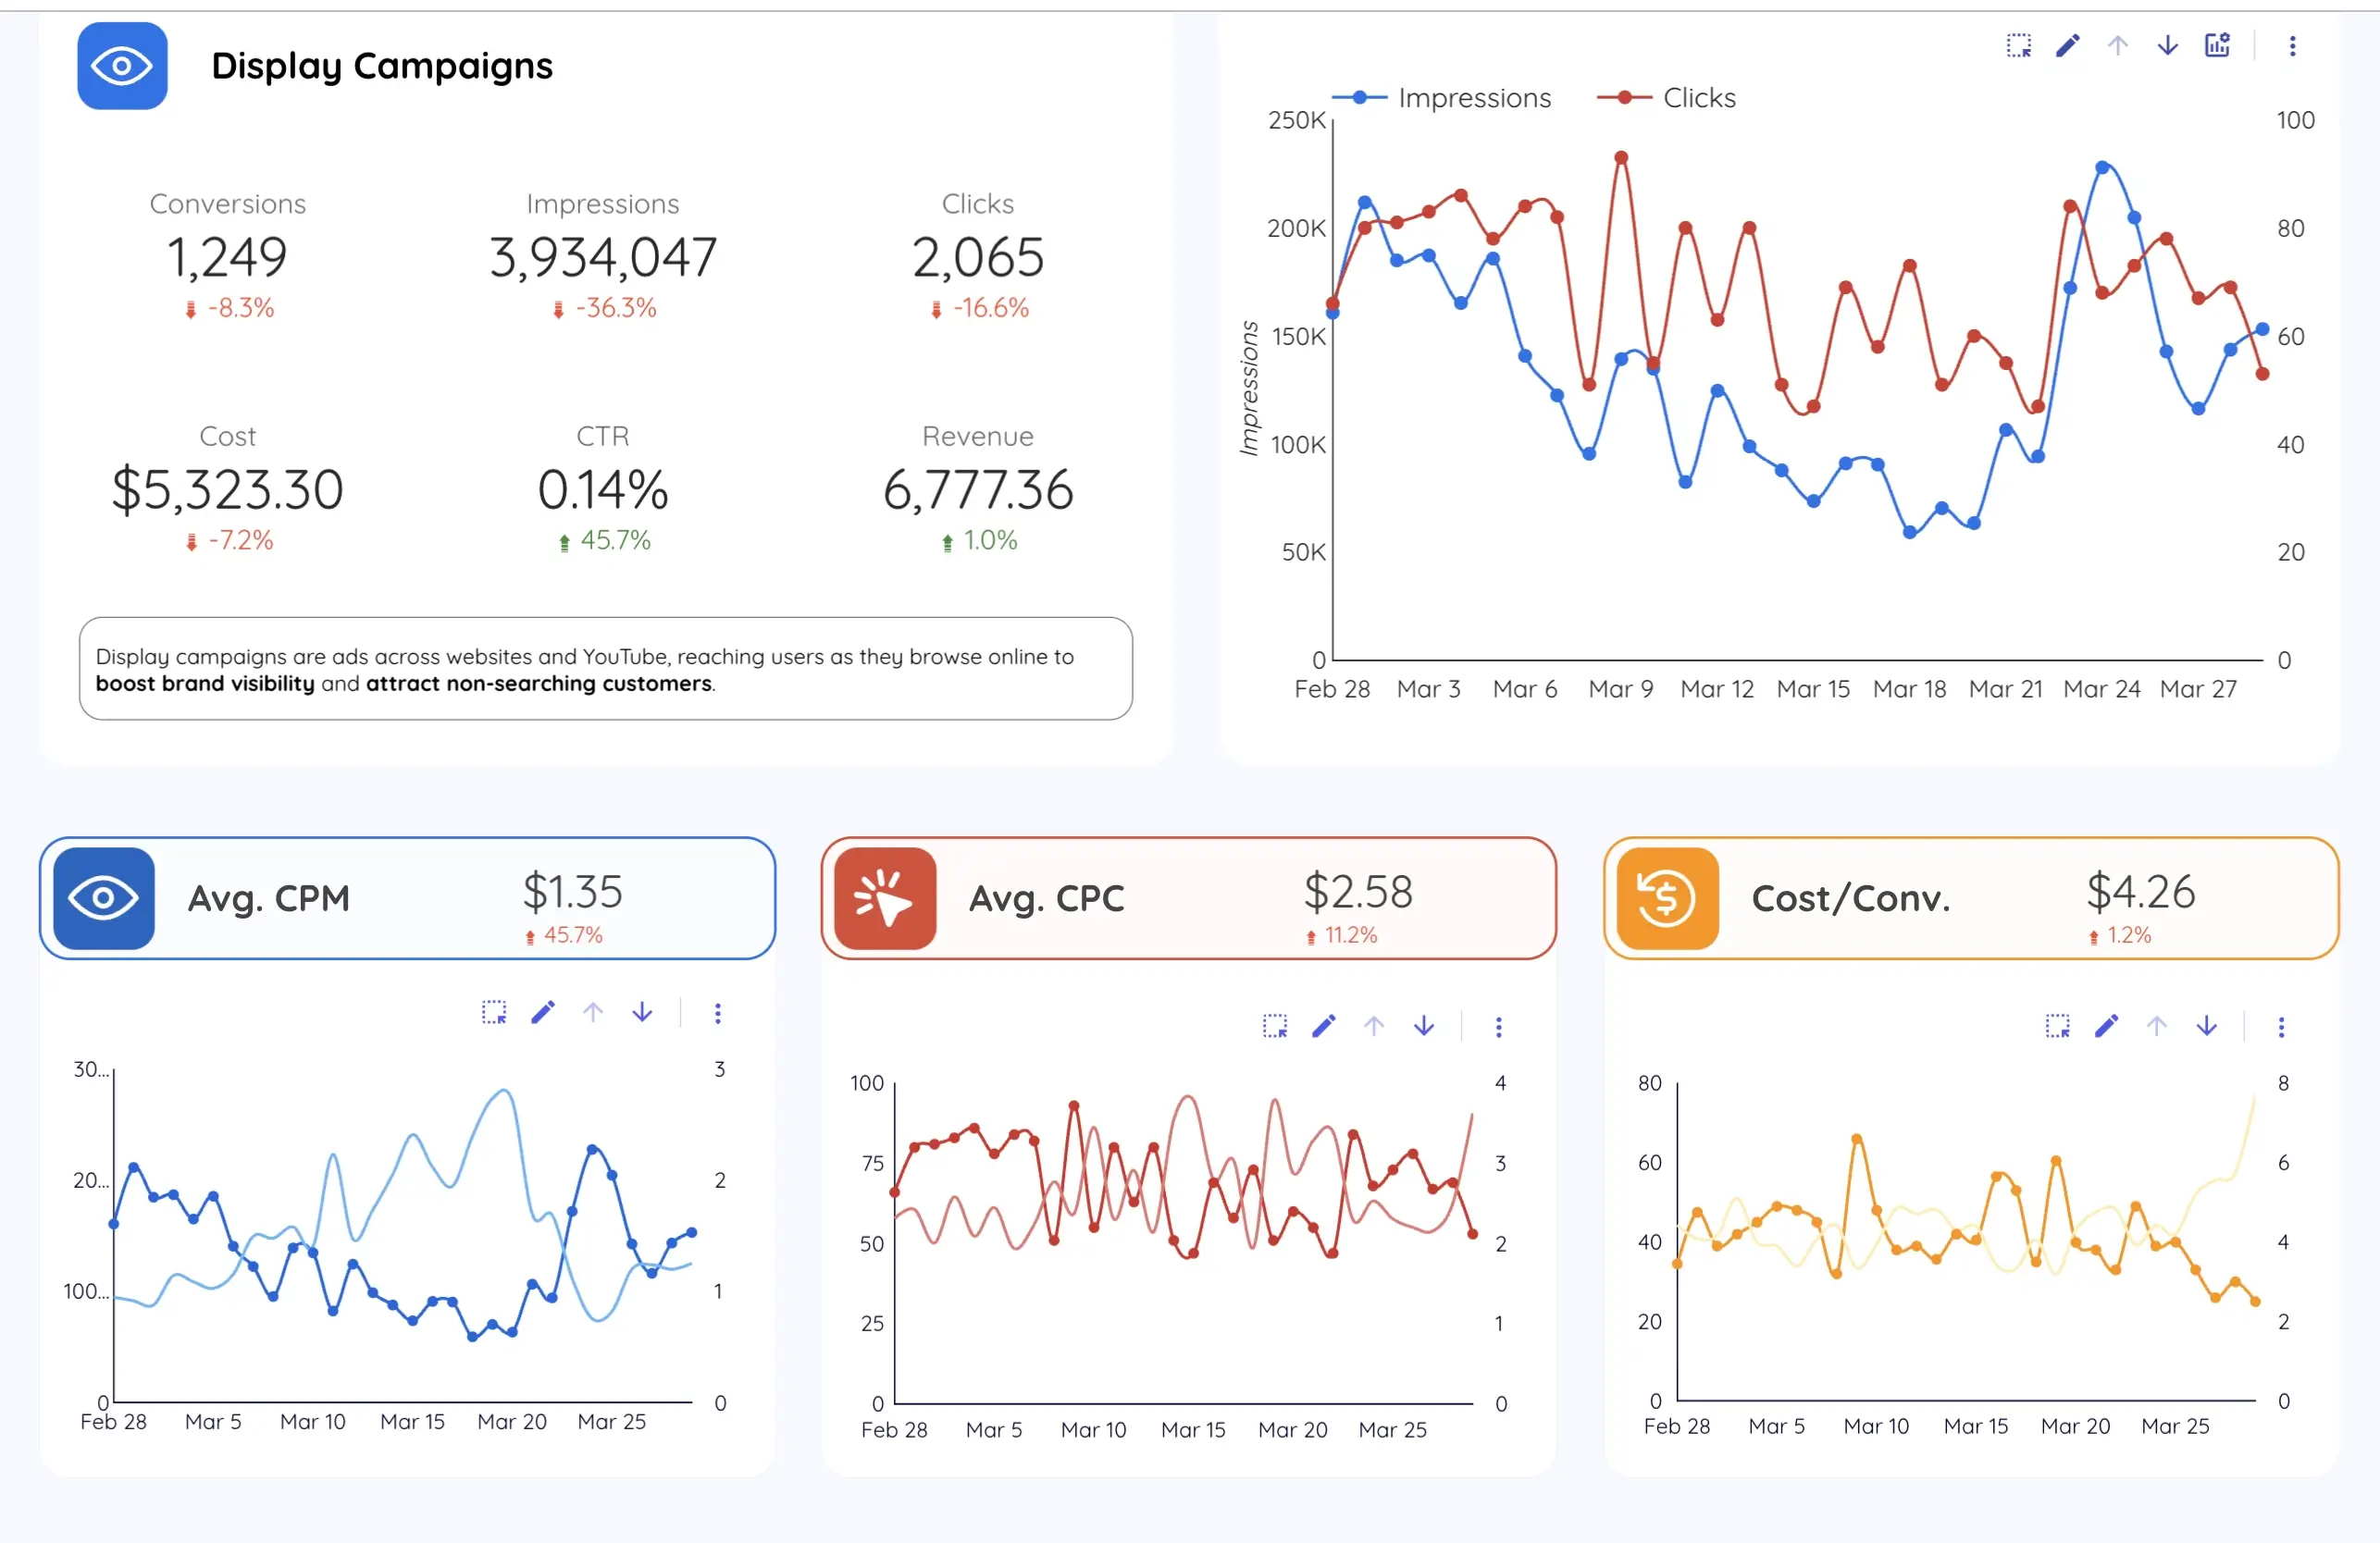
Raw numbers show what is happening.
Trendlines show where things are going.
Adding a trendline to your time series charts helps reveal patterns that aren’t obvious from the day-to-day data points—especially for long-term analysis or executive reporting.
What Trendlines Reveal
- Growth or decline over time
- Seasonality or cyclical behavior
- The impact of major campaigns or product launches
- Whether metrics are stabilizing, accelerating, or declining
How to Add a Trendline
- Insert a time series chart in your report.
- In the Style panel (right-hand side), scroll down to Series options.
- Enable the option called “Show trendline”.
- Choose the trendline type (linear is most common; exponential for growth models).
- Customize the appearance (line color, thickness, etc.) to match your design theme.
When to Use Trendlines
- Showing long-term performance of KPIs (e.g., sessions, revenue, churn)
- Tracking growth post-campaign or post-launch
- Highlighting seasonal dips or peaks
- Comparing multiple trendlines across products or regions
Best Practices
- Use only with datasets that have a clear timeline (e.g., daily, weekly, monthly)
- Avoid adding trendlines to volatile short-term data—they can mislead
- Label the trendline clearly so users understand what it represents
- Use muted colors to keep the trendline subtle but noticeable
Trendlines turn your dashboards into narratives.
They connect the dots—literally—and help stakeholders see not just what happened, but what’s happening next.
10. Use Drill Down to Add Depth Without Overwhelming the Viewer
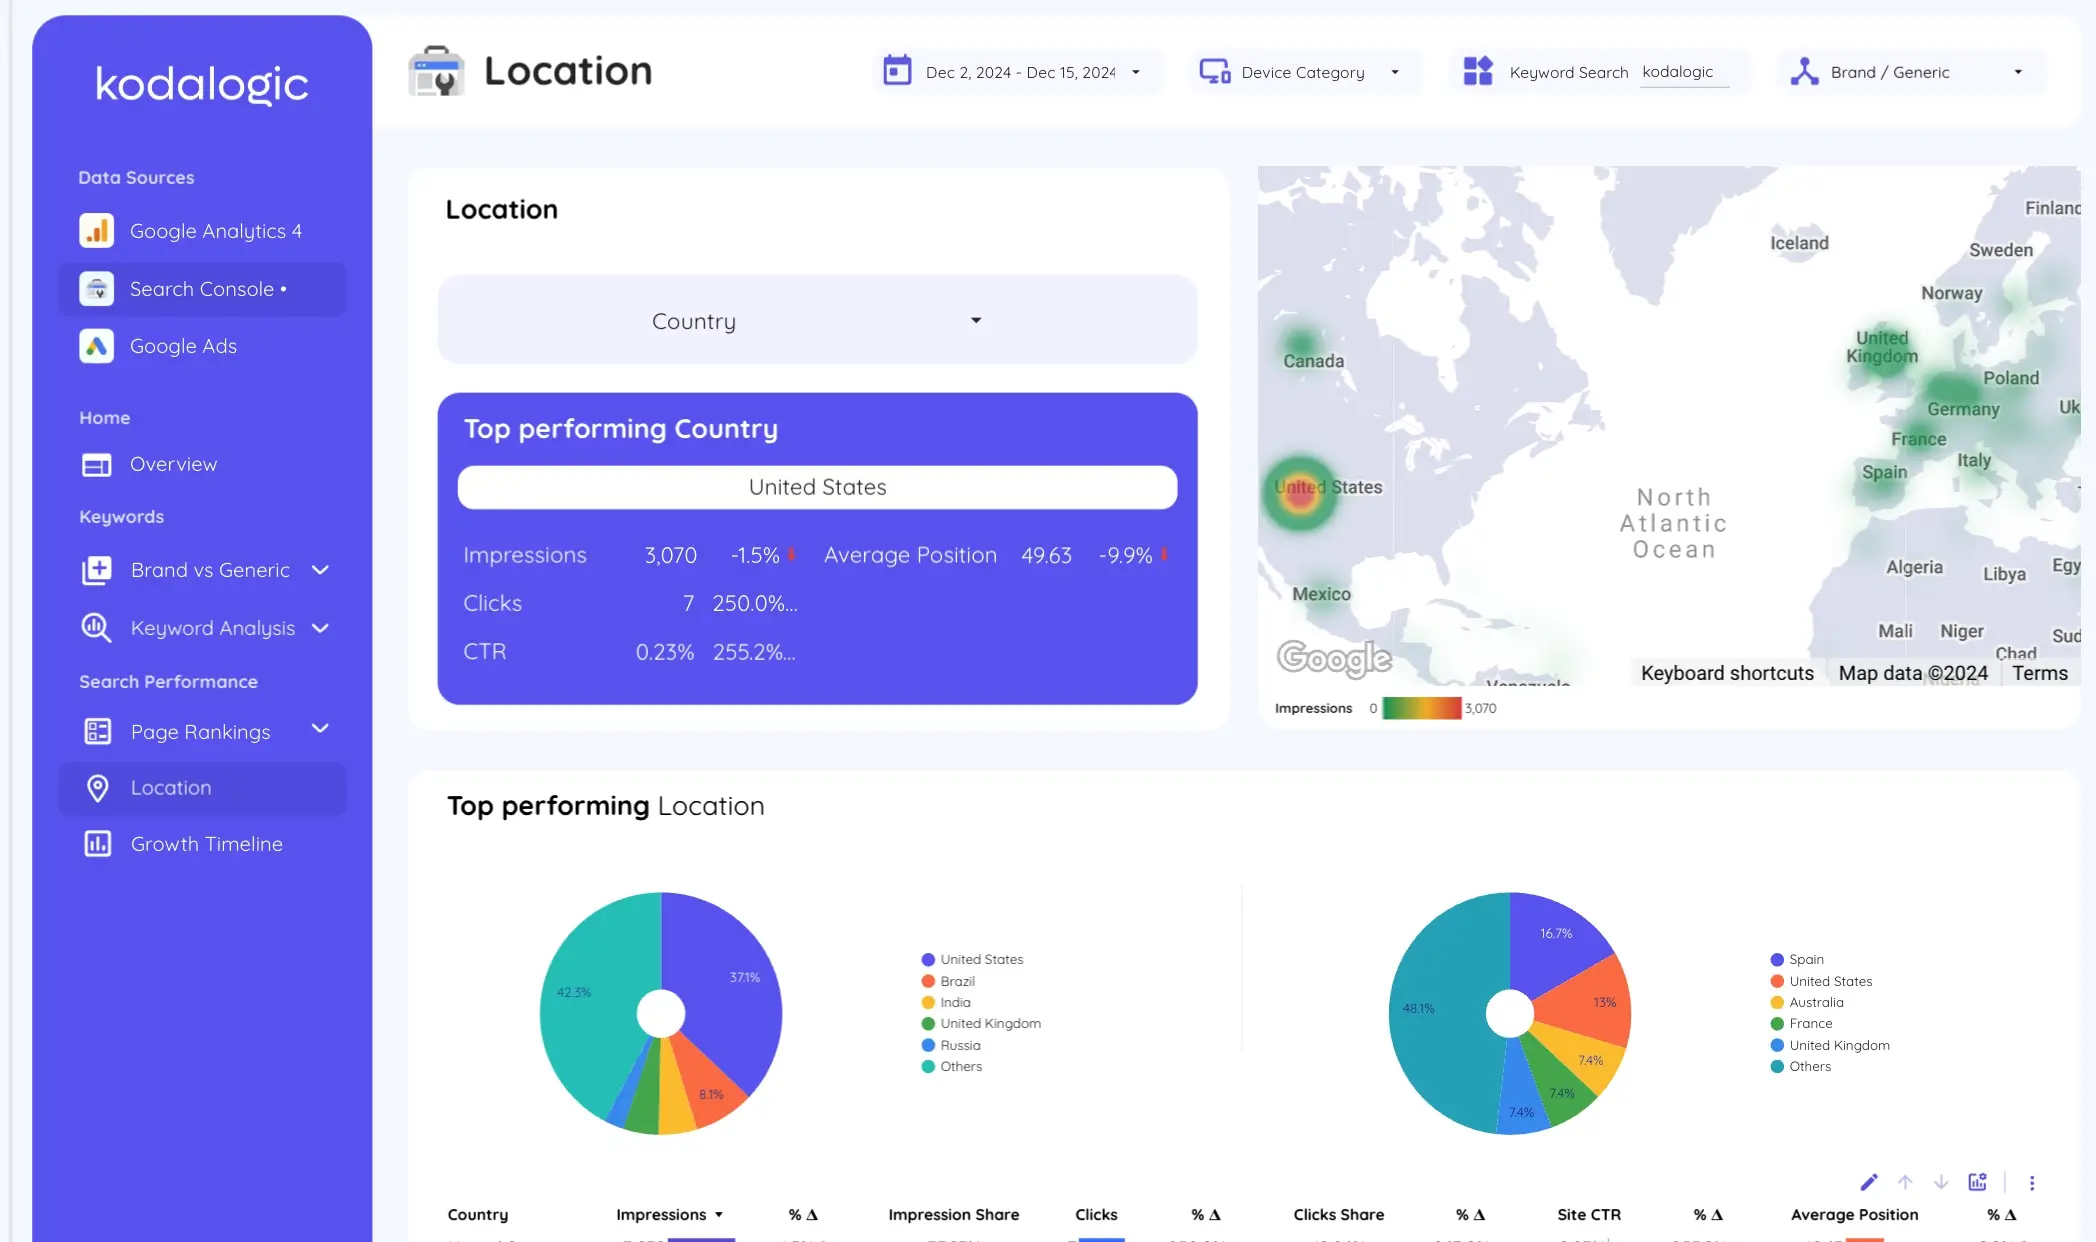
A dashboard should never feel crowded.
But hiding valuable detail isn't the answer either.
With drill down functionality, Looker Studio lets you keep things clean on the surface—while still allowing users to explore deeper layers of the data on demand.
What Drill Down Does
It allows users to click on a chart and progressively reveal more detailed views.
For example:
- From continent to country to city
- From campaign group to campaign to ad creative
- From product category to SKU
How to Set It Up
- Select a chart (e.g., bar, pie, table) that supports drill-down.
- In the Data panel, select multiple dimensions in order of hierarchy.
- Example: Continent > Country > City
- Enable the option “Drill down” by checking the box below the dimension list.
- Preview the report and click on a value—Looker Studio will automatically load the next level.
Where It Works Best
- Geo segmentation
- Campaign performance across multiple levels
- Product or SKU-level performance
- Time-based breakdowns (Year > Quarter > Month)
Best Practices
- Use intuitive hierarchies that mirror how the business thinks
- Keep dimension names clear and standardized
- Combine with page-level filters to maintain contextual relevance
- Add tooltips or microcopy to indicate that drill-down is available
Drill down gives your dashboard structure.
You no longer have to choose between simplicity and depth—you can have both, layered logically and beautifully.
11. Export Dashboards to PDF for Polished Offline Sharing
Not every stakeholder will access your dashboards inside Looker Studio.
Some prefer printed reports, PDF attachments, or presentations where interaction is not possible.
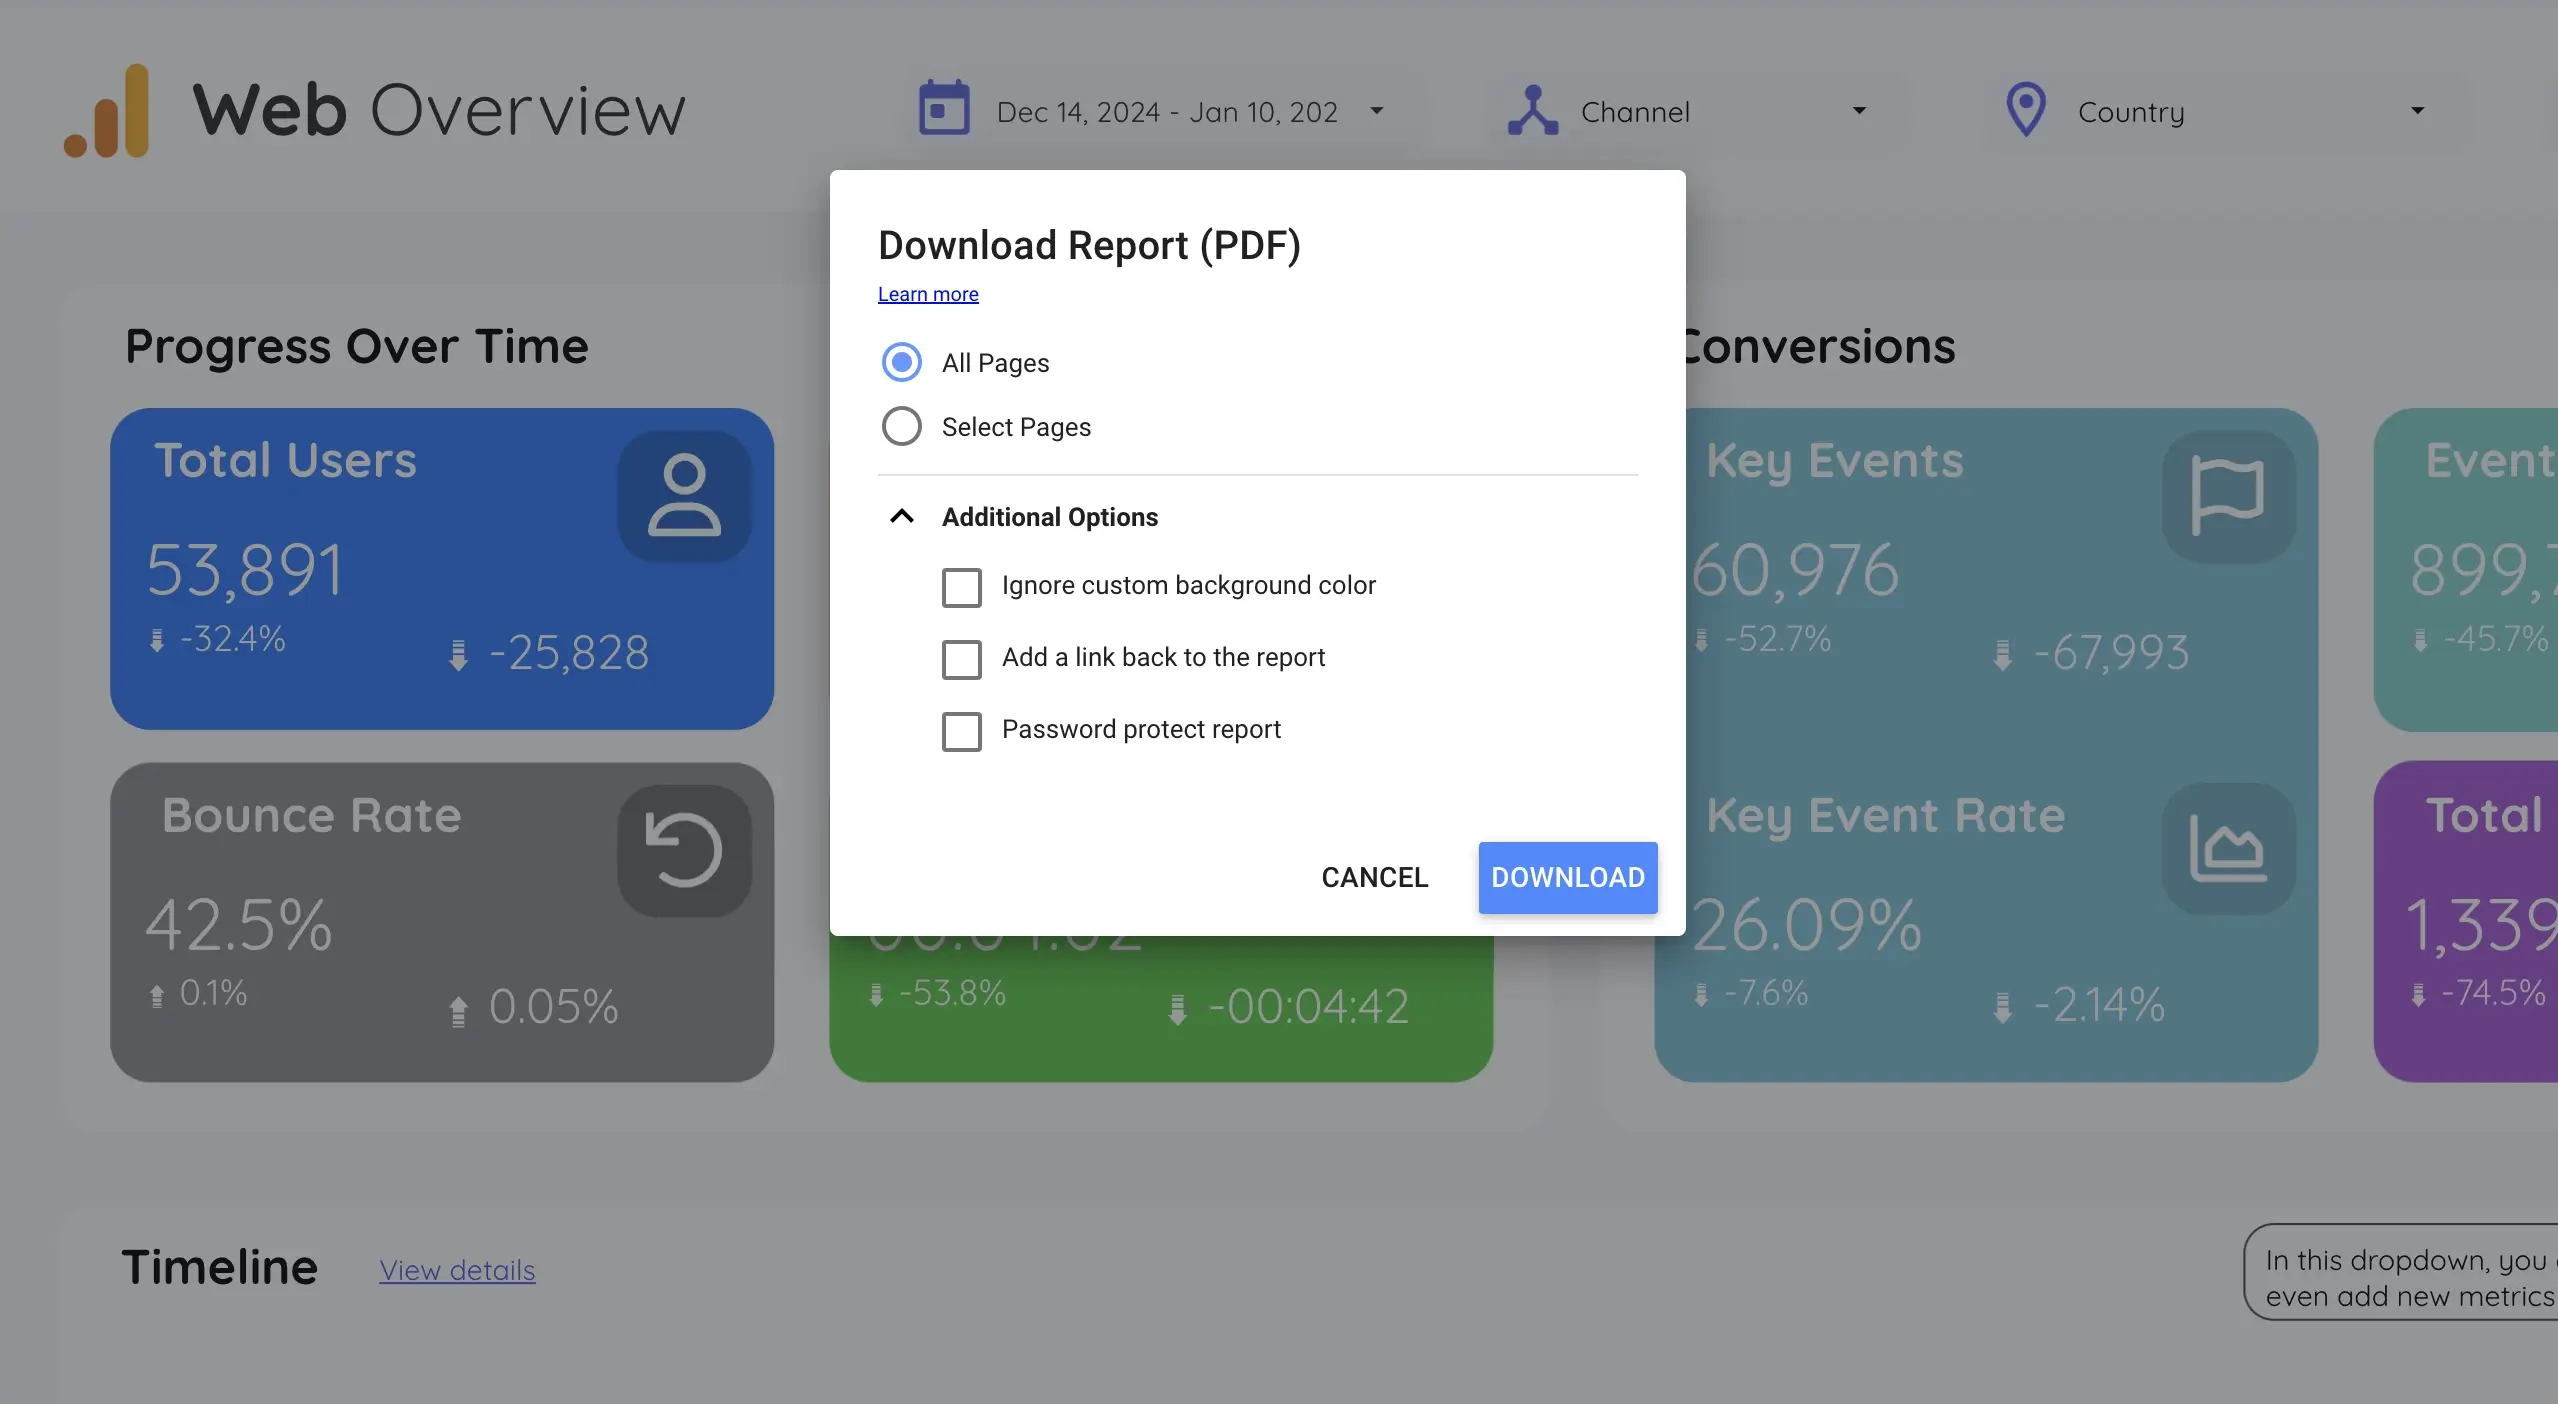
That’s why Looker Studio allows you to export reports as high-quality PDFs—ideal for board meetings, client reports, and archival purposes.
When to Export as PDF
- Monthly or quarterly reporting cycles
- Presentations to stakeholders who prefer static documents
- Sharing reports with clients who don’t have Looker Studio access
- Offline analysis or internal compliance documentation
How to Export a Report
- Open your dashboard in View mode (not Edit).
- Click the Share button in the top right corner.
- Select “Download report”.
- Choose your preferences:
- Pages to export (all or select)
- Layout: Landscape is usually better for dashboards
- Include background colors and images
- Repeat controls on every page if needed
- Click Download to generate the PDF.
Tips for Polished PDF Exports
- Use consistent page sizes (16:9 or A4 for better print layout)
- Avoid scrollable tables—only the visible part will be included
- Align charts and text within a visible print-safe margin
- Preview in View mode to see how it will look on paper
Best Practices
- Add headers and footers for report title and date
- Use subtle backgrounds and gridlines for structure
- Include a final summary page if the report is long
- Optimize file size by removing unused pages or large images
Exporting doesn’t mean compromising quality. With the right setup, your Looker Studio report can become a presentation-ready PDF that looks as good on paper as it does on screen.
Reference article: How to Share Looker Studio Dashboards Effectively
12. Schedule Automatic Report Delivery So You Never Miss a Deadline
Data should flow to your team without friction.
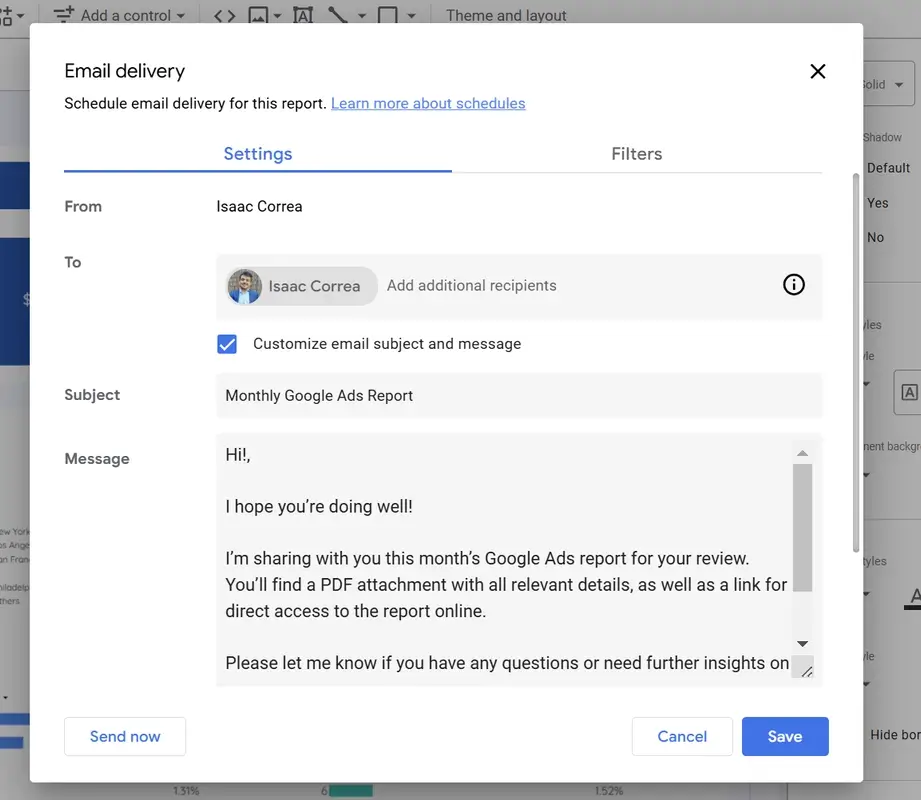
Looker Studio makes this easy with scheduled email delivery, letting you automate your reporting without extra tools or manual exports.
Whether it’s a weekly KPI update or a monthly executive summary, automatic delivery keeps everyone informed—without reminders or follow-ups.
When to Use Scheduled Delivery
- Weekly campaign performance updates to marketing teams
- Monthly sales reports for leadership
- End-of-quarter summaries sent to clients
- Project monitoring dashboards shared across departments
How to Schedule an Email Report
- Open your report in View mode.
- Click the Share button in the top right corner.
- Select “Schedule email delivery”.
- Choose your recipients (enter email addresses manually).
- Set your preferences:
- Frequency (daily, weekly, monthly)
- Time of day (based on your local timezone)
- Subject line and message body
- PDF attachment options (same as export settings)
- Save the schedule. You’ll receive confirmation and future deliveries will run automatically.
Best Practices
- Use clear, informative subject lines (e.g., “Weekly Marketing KPIs – March 25”)
- Send different views to different teams (e.g., filtered dashboards per region)
- Test the first delivery with your own address
- Review schedules quarterly to ensure they’re still relevant
Automated reporting keeps your data in motion. It ensures your team sees the metrics they need—before they even have to ask.
Reference article: How to Schedule a Dashboard in Google Looker Studio for Email Delivery
13. Use Map Visualizations to Show Where Performance Happens
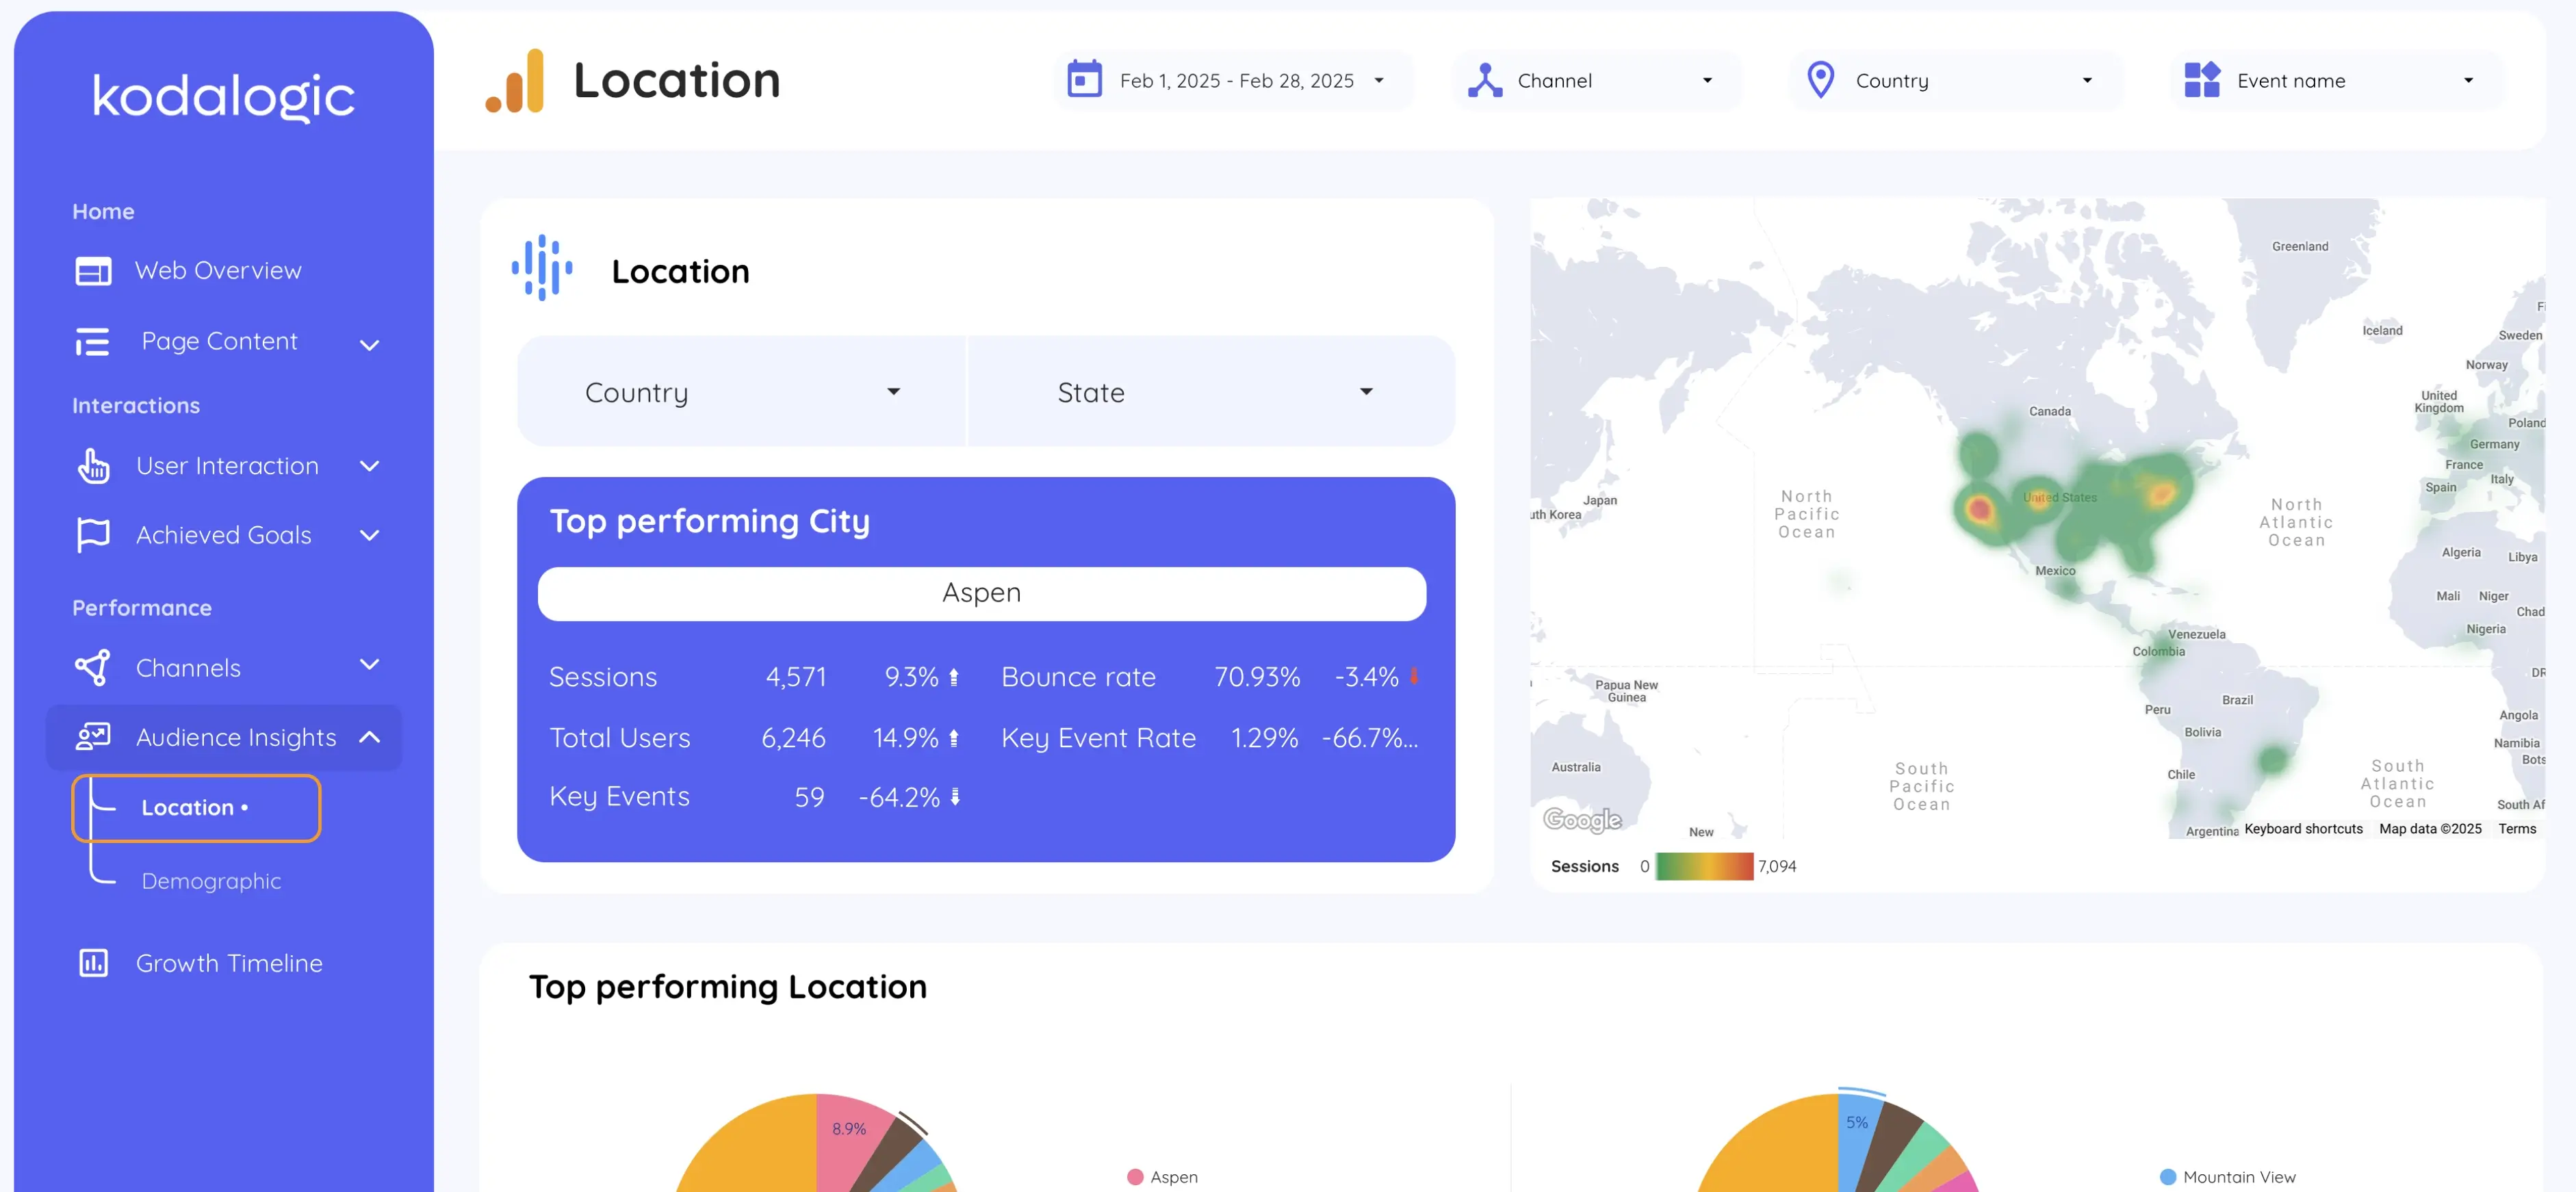
Sometimes, where something happens is just as important as what happened.
Looker Studio includes geographic visualizations that allow you to plot data across countries, regions, or cities—turning raw numbers into spatial insights.
These Looker Studio map visualizations (also referred to as “Google Data Studio maps”) help users understand location-based performance at a glance.
What You Can Visualize
- Sessions or users by country
- Revenue by region or sales territory
- Leads by city
- Campaign reach across continents
- Store performance by zip code (with custom geo data)
How to Add a Map to Your Dashboard
- Click “Add a chart” > “Geo map” or “Filled map” from the top menu.
- Place it in your layout and resize as needed.
- In the Data panel:
- Set a geo dimension (e.g., Country, Region, City)
- Set a metric (e.g., Sessions, Revenue, Orders)
- In the Style panel:
- Choose color gradients or circle sizes for emphasis
- Adjust map background and border colors
- Add tooltips or legends for clarity
Best Practices
- Ensure your geo data is standardized (e.g., "United States" not "USA")
- Use maps for trends—not for precise values
- Avoid crowding maps with too many overlapping data points
- Combine maps with filters (e.g., by product line or date range)
Maps add a new dimension to your analysis—literally.
They turn isolated numbers into geographic stories that are easier to explore, present, and act on.
14. Highlight Key Metrics with Scorecards That Communicate Instantly
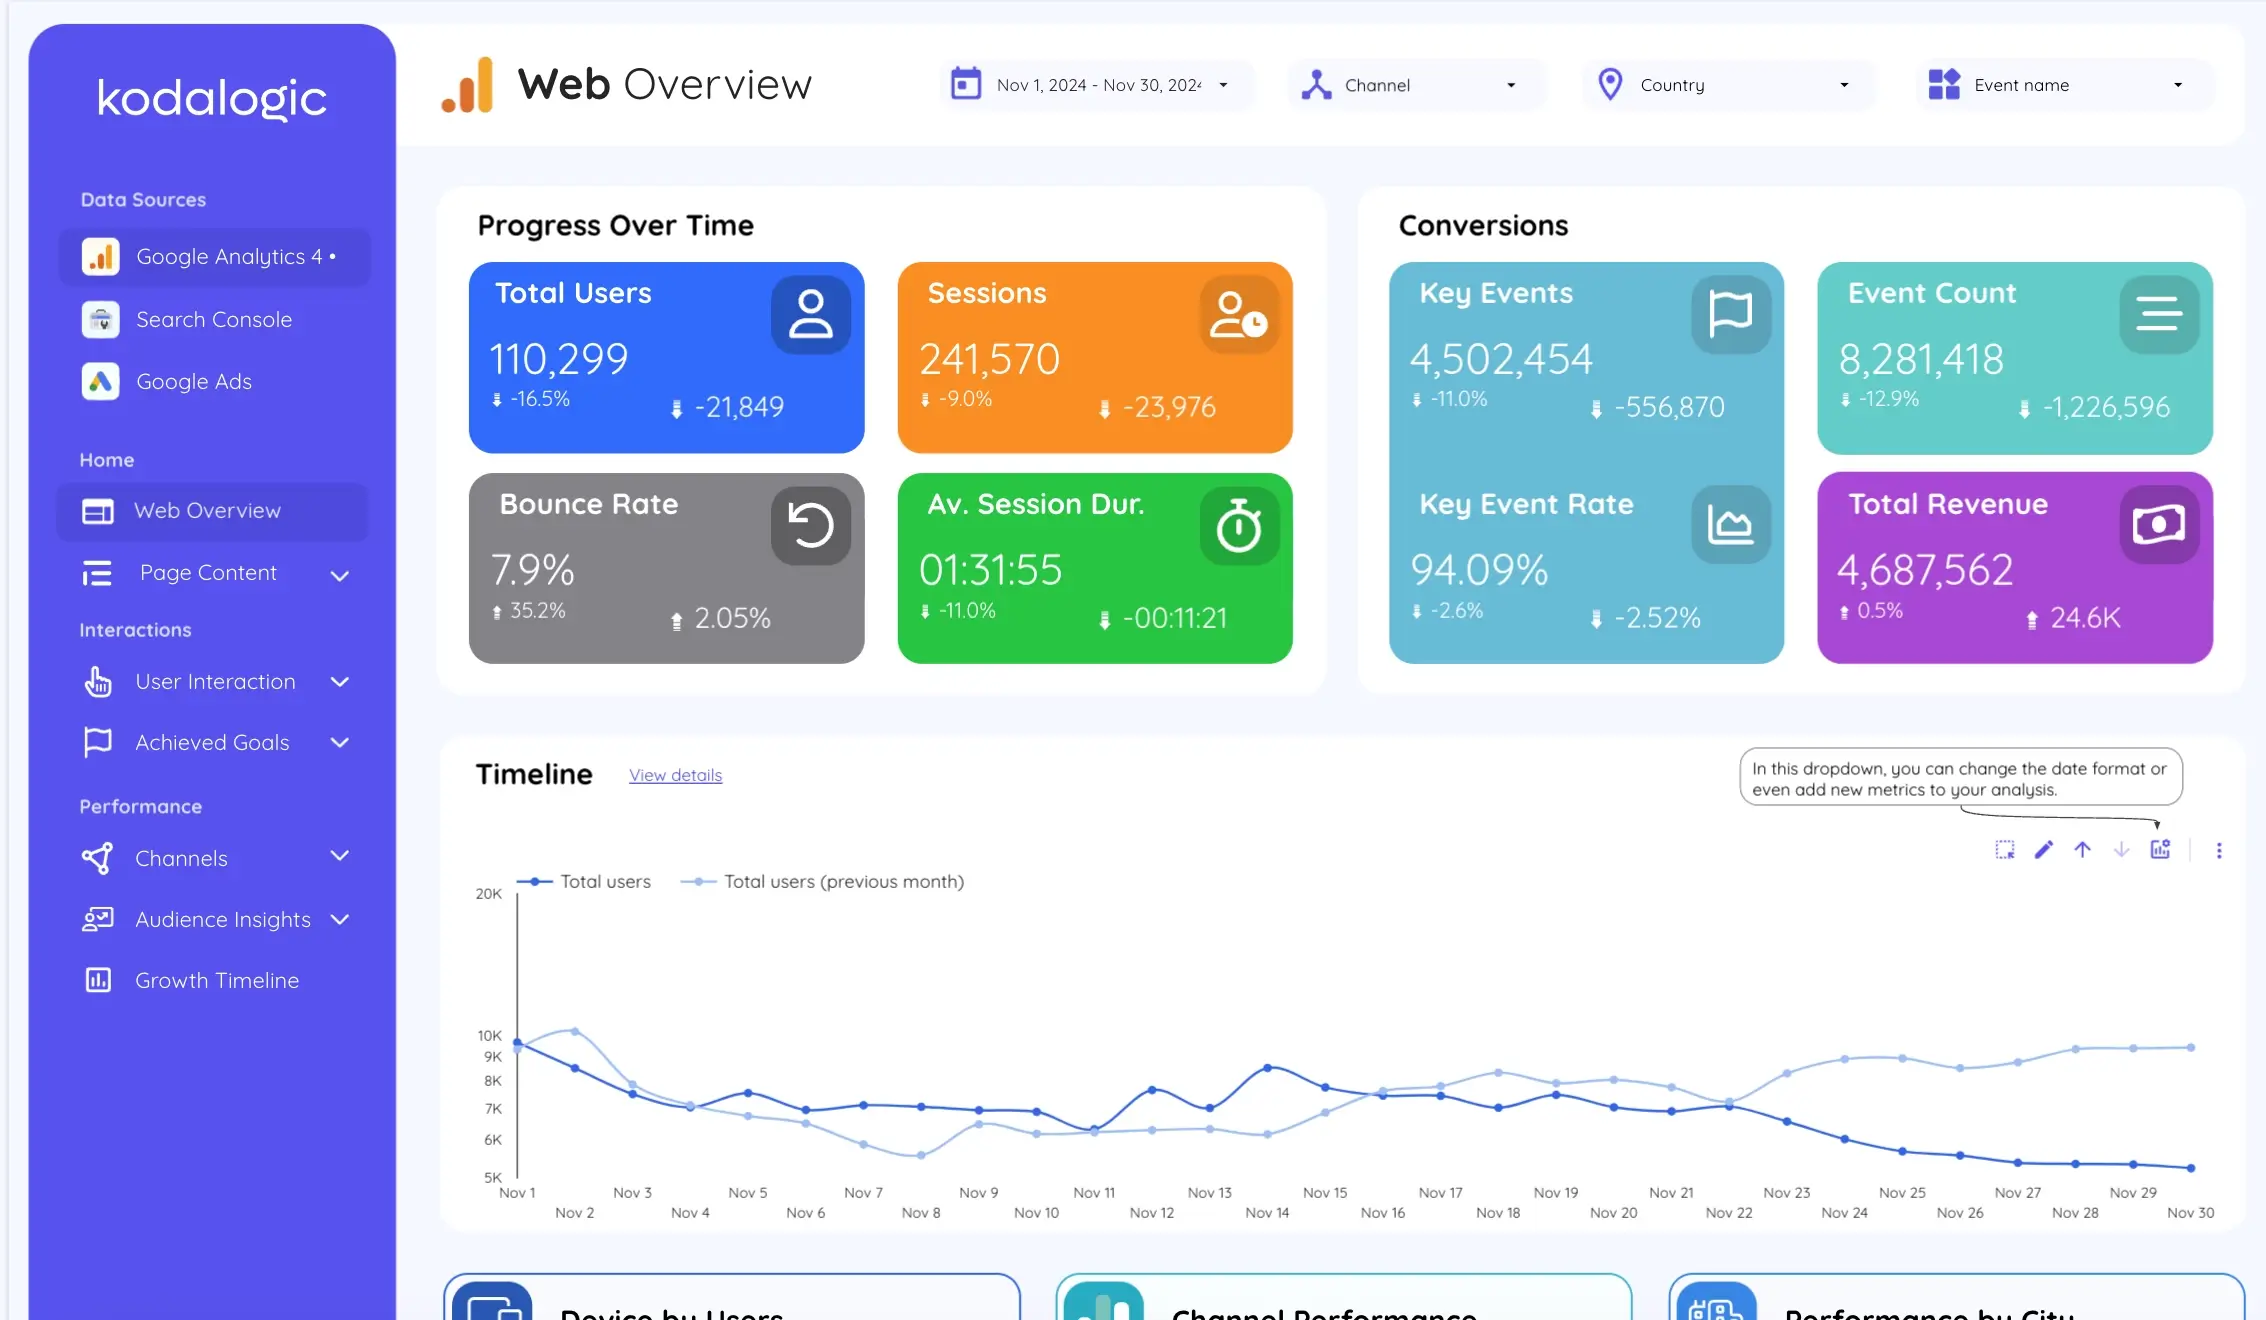
Not every number deserves a chart.
Sometimes, the clearest way to communicate performance is with a single figure—centered, bold, and unmistakable.
Scorecards in Looker Studio are designed exactly for that: to show KPIs at a glance.
They are ideal for tracking top-line results such as revenue, conversion rate, bounce rate, or cost per lead—metrics that matter instantly, and consistently.
What Makes Scorecards Effective
- They provide focus
- They simplify reporting for decision-makers
- They create visual hierarchy on the page
- They support conditional formatting and comparison
How to Add and Configure a Scorecard
-
Click “Add a chart” > “Scorecard” from the top menu.
-
Place the component at the top of your dashboard or section.
-
In the Data panel, select the metric to display (e.g., Sessions).
-
To enable period comparison:
- Scroll down to “Comparison date range”
- Check “Compare with previous period” or “Same period last year”
- Looker Studio will display the delta (+/- percentage change)
-
In the Style panel:
- Adjust font size and weight
- Add color indicators for positive/negative change
- Include a background or border for emphasis
- Align and group scorecards evenly across the layout
Best Practices
- Use no more than 3–6 scorecards per page
- Label them clearly (avoid abbreviations or internal terms)
- Always show context (trend, period, or comparison)
- Group them together in a summary section
Scorecards are not just visuals—they are statements.
They tell your audience what matters right now, without requiring interpretation.
15. Create and Reuse Template Dashboards to Scale Your Reporting
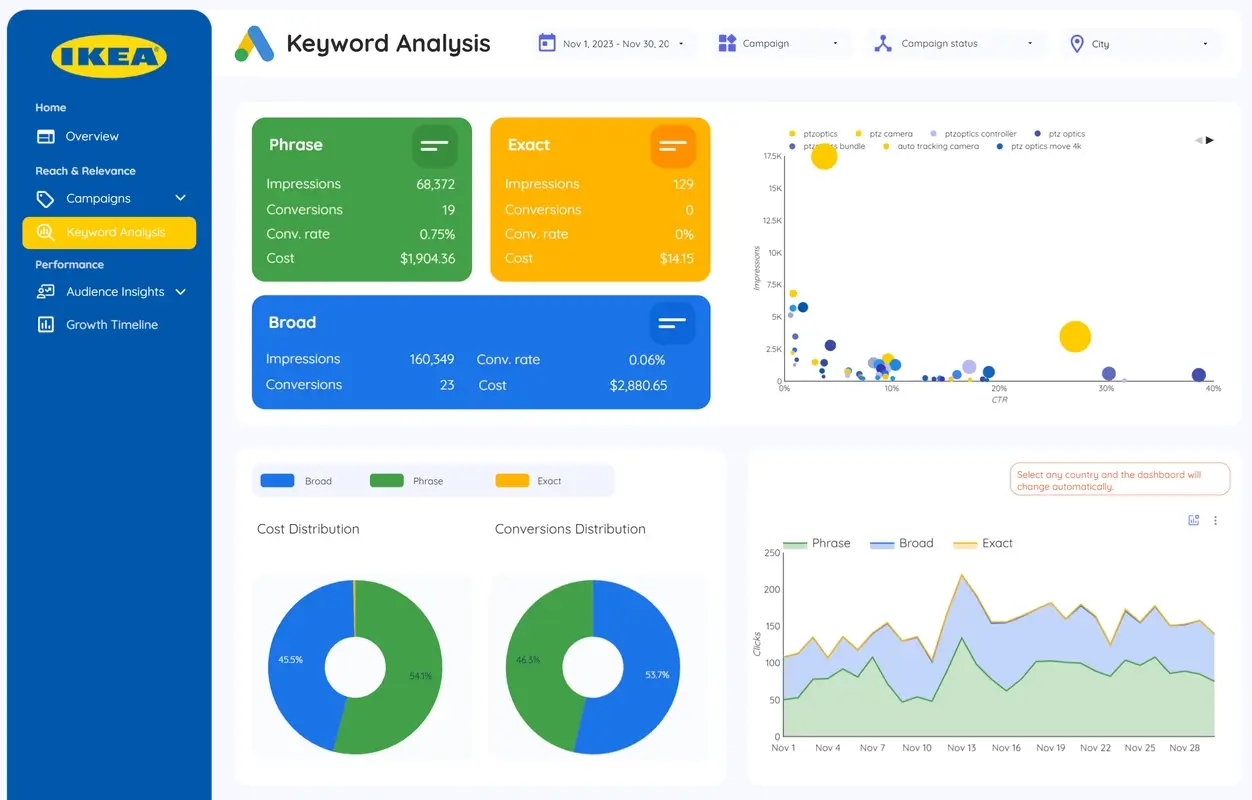
Once you’ve built a dashboard that works—one that combines clarity, speed, and precision—don’t start from scratch the next time.
Looker Studio allows you to save any report as a template, so you can reuse the structure, style, and logic across clients, departments, or projects.
This is how you scale your reporting efforts without sacrificing quality or consistency.
Why Templates Matter
- Save time when onboarding new clients or teams
- Maintain visual consistency across multiple dashboards
- Enforce data structure standards across your organization
- Accelerate delivery without compromising on design
How to Create a Template
- Finish building your dashboard with placeholder data or sample values.
- From the File menu, click “Make a copy”.
- When prompted:
- Select new data sources for each chart (or keep them as placeholders)
- Rename the dashboard to reflect its new use case
- Save and publish the new version.
For wider distribution, you can:
- Publish the template as a shared link
- Provide a custom template gallery for internal teams
- Offer documentation for how to connect new data sources
Best Practices
- Keep metric and dimension names generic where possible
- Add instructional text boxes for setup guidance
- Remove client-specific filters or branding before saving
- Create a “template version” with dummy data to preserve structure
Templates don’t just save time—they standardize quality.
They ensure every dashboard you create lives up to the same level of professionalism and performance.
Reference article: Are Free Looker Studio Templates Enough for Your Business?
Final Thoughts: From Dashboard to Decision
Great dashboards are not just built—they’re designed with purpose.
Every chart, control, filter, and color should move the viewer closer to understanding.
And that understanding should lead directly to better action.
With the 15 techniques outlined in this guide, you're no longer just visualizing data.
You're shaping how your organization thinks about it. How it sees progress. How it makes decisions.
You now have the tools to create dashboards that are:
- Technically solid
- Visually consistent
- Strategically aligned
But more importantly, dashboards that are used—because they make sense.
From Clarity to Impact
If you're ready to go even faster, our team at Kodalogic has already embedded these best practices into a collection of professionally designed Looker Studio templates.
No setup required. No design overhead.
Just connect your data, and watch your insights take shape—faster than you thought possible.
We believe in dashboards that don’t just report—but reveal.
And if you're reading this, you're probably ready to build yours.